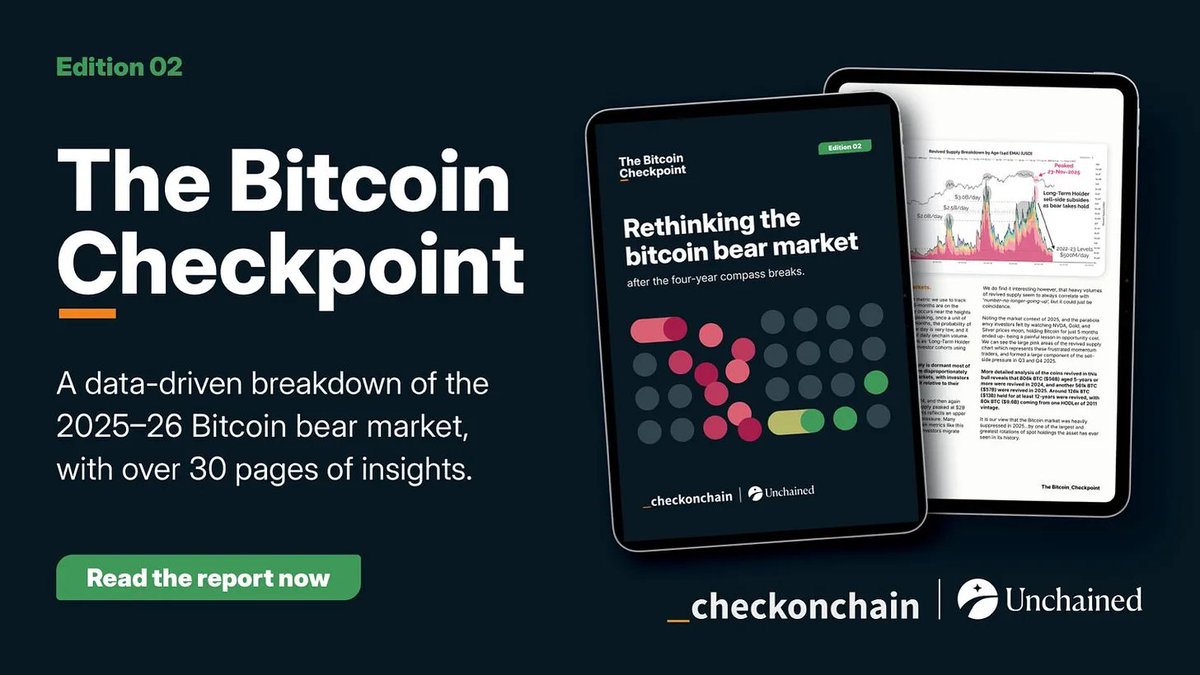
The Checkonchain team is proud to launch the 2nd edition of The Bitcoin Checkpoint report, in partnership with our friends at @unchained.
In this 30+ page report, @_Checkmatey_ provides a data-driven breakdown of Bitcoin’s 2025–26 bear market, using a wide range of data-sets across spot, onchain, ETF, and derivatives markets.
Get the full report here👉 https://t.co/PDKhop6D2I.
In the report, we assess:
- How the 2025 bull market topped, and the role of spot sell-side pressure.
- The mechanics of the drawdown, and what drove the move to $60k.
- The two major capitulation events that have shaped this bear.
- How over 2.0M BTC has rotated into a new cost basis range.
- Why models like the True Market Mean are increasingly relevant.
- Our base case thesis for where we believe this bear market bottoms out.
Check out the full report 👉 https://t.co/PDKhop6D2I.
Resilience as an investor is all about how quickly you can rebound from the shock value of a market move, and adjust to the cards that lay on the table.
In our latest newsletter piece, @_Checkmatey_ examines Bitcoin's latest sell-off, how investors are responding beneath the surface, and what the probabilities suggest about prices at 66k.
Get it here: https://t.co/Gu1xKqd46w
Strategy just sold Bitcoin for only the second time in its history.
The sale was small - just 32 BTC out of a treasury of 843,706 coins - but it raises a much bigger question:
What does this sale tell us about how Strategy intends to manage its balance sheet going forward?
In our latest newsletter piece, @_Checkmatey_ examines the sale, the firm's evolving capital structure, and the risks investors should understand when analysing the world's largest corporate Bitcoin treasury → https://t.co/NAeqsUxgwb
Every red candle feels like impending doom.
Every green candle brings back just enough hope to make recovery feel possible.
Then the next red candle arrives, and the bear market feels like it will last forever.
In our latest newsletter piece, @_Checkmatey_ explores the frameworks he uses to remove emotion from the decision-making process, focus on probabilities instead of predictions, and navigate bear markets with a clear head → https://t.co/LQ4gxtcemB
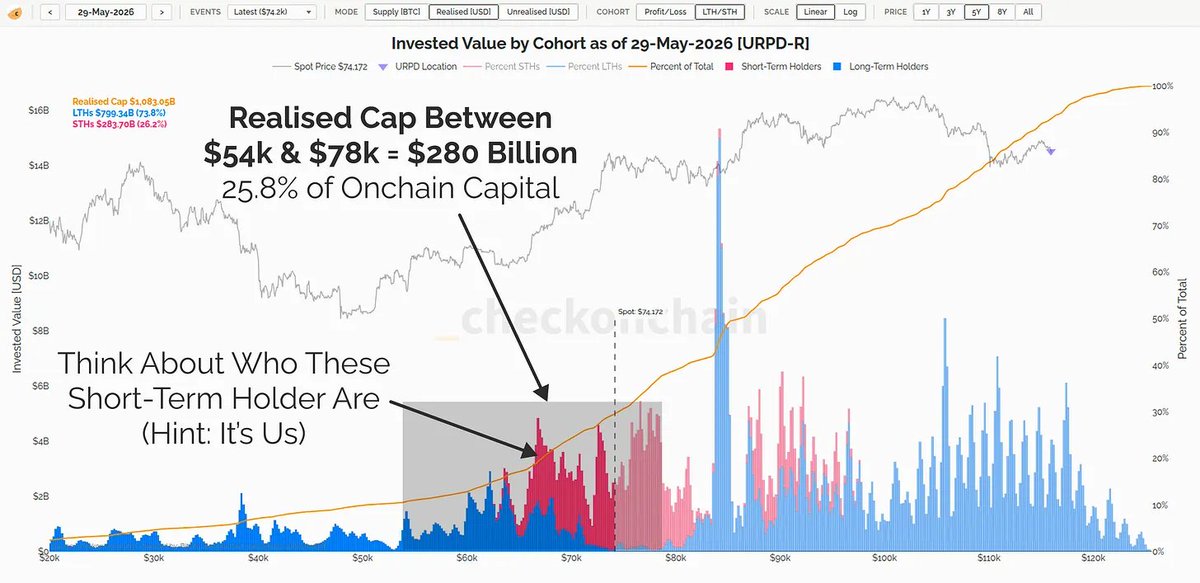
Some insights explored in the article:
- 25.8% of Bitcoin's Realised Cap has accumulated within the current trading range
- Less than 3% of recently spent coins came from holders with a cost basis below $60k
- Coinday Destruction remains at historic lows
- Prices below $80k sit within the bottom third of the historical mean reversion distribution
There are loud creaks coming from the foundation of the fiat system, as bond yields push to multi-decade highs and commodity markets begin reasserting inflationary pressure.
In our latest newsletter piece, @_Checkmatey_ examines why the real bear market may actually be unfolding in government bonds, and how commodities, infrastructure spending, and currency debasement all tie into Bitcoin’s long-term thesis → https://t.co/aWC4WflmRp
Some insights explored in the article:
- The 40-year bond bull market likely ended in 2020, with yields structurally trending higher since 2022
- Gold appears to have kicked off a broader decade-long commodity and hard-asset cycle
- Rising commodity prices and infrastructure spending are creating renewed inflationary pressure globally
- Bitcoin sell-side activity has collapsed to generational lows, signalling extreme market apathy and equilibrium
The Australian government just proposed sweeping changes to the capital gains tax system.
The policy was pitched as a way to improve housing affordability for young Australians.
But after running the numbers, @_Checkmatey_ found the changes may actually make it harder for young Aussies to build wealth, save for a deposit, and climb the asset ladder.
Watch the full breakdown here:
https://t.co/s71Z4WbM5e
At the Feb-2026 low, over 80% of all capital invested in Bitcoin was underwater.
Historically, bear markets only end after enough of those underwater coins transfer to stronger hands at lower prices.
This is the “capital rotation” process that slowly transforms a top-heavy market into a bottom-heavy one.
The chart below shows how much Bitcoin supply was repriced between $54k-$75k.
If you want to understand what bottom formation actually looks like structurally, download The Bitcoin Checkpoint → https://t.co/Oa3FlKZZNI
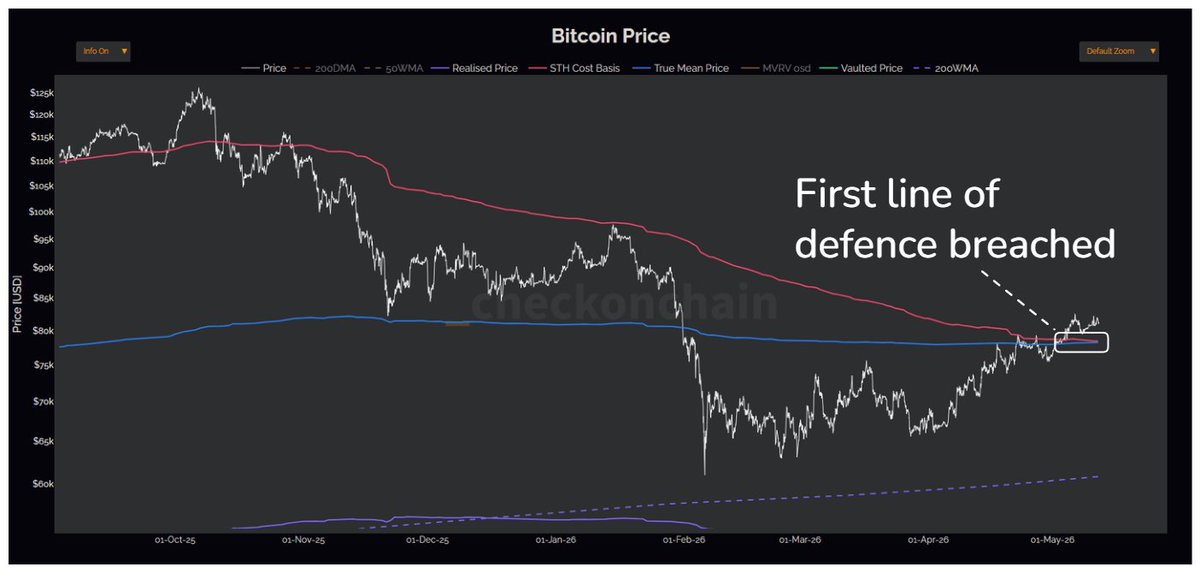
Bitcoin has recently reclaimed the bears first line of defence at $78k, a level aligned with the True Market Mean and Short-Term Holder cost basis. Historically, sustained moves above this region tend to coincide with a meaningful improvement in investor sentiment and market structure.
In our latest newsletter piece, @_Checkmatey_
examines why reclaiming this threshold matters, and what signals are beginning to turn constructive beneath the surface → https://t.co/GYJtYxfdT0
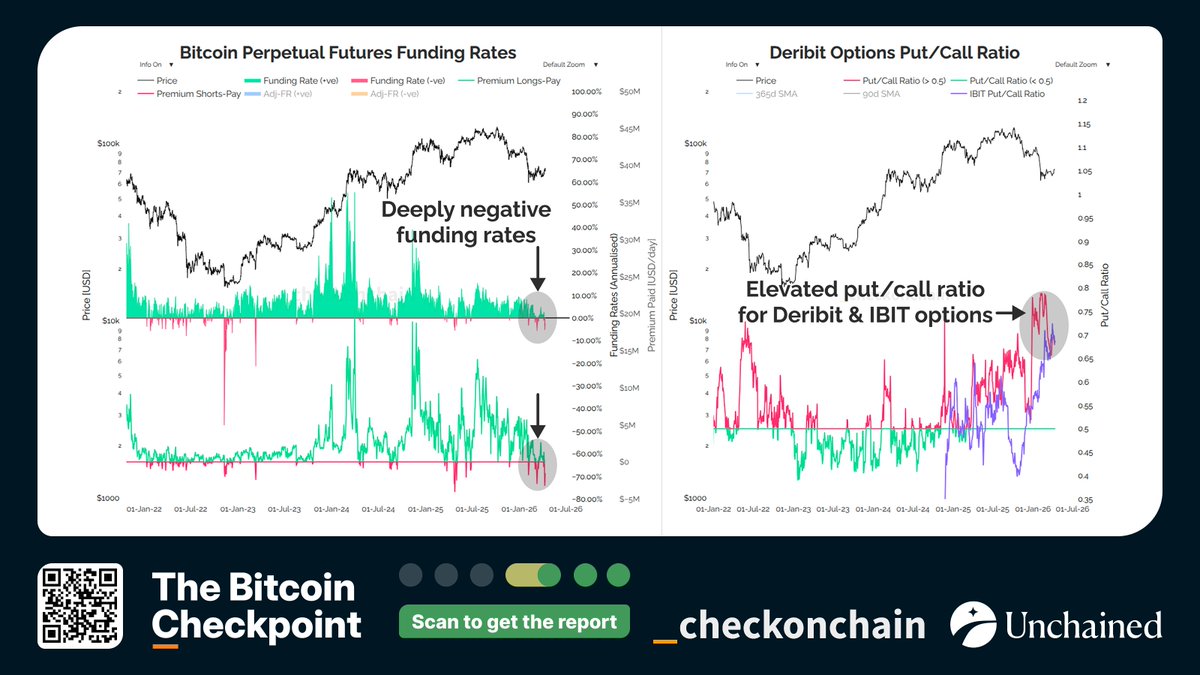
Bitcoin speculators spent most of the bear market trying to catch the falling knife.
Only AFTER price reached $60k did traders finally flip aggressively bearish.
• Funding rates turned deeply negative
• Put/call ratios surged
• Short positioning exploded
In other words:
The crowd finally decided to short after Bitcoin was already down -50%.
The chart below compares futures funding and options positioning during the capitulation phase.
If you want to understand how this Bitcoin bear market actually unfolded beneath the surface, download The Bitcoin Checkpoint → https://t.co/Oa3FlKZZNI
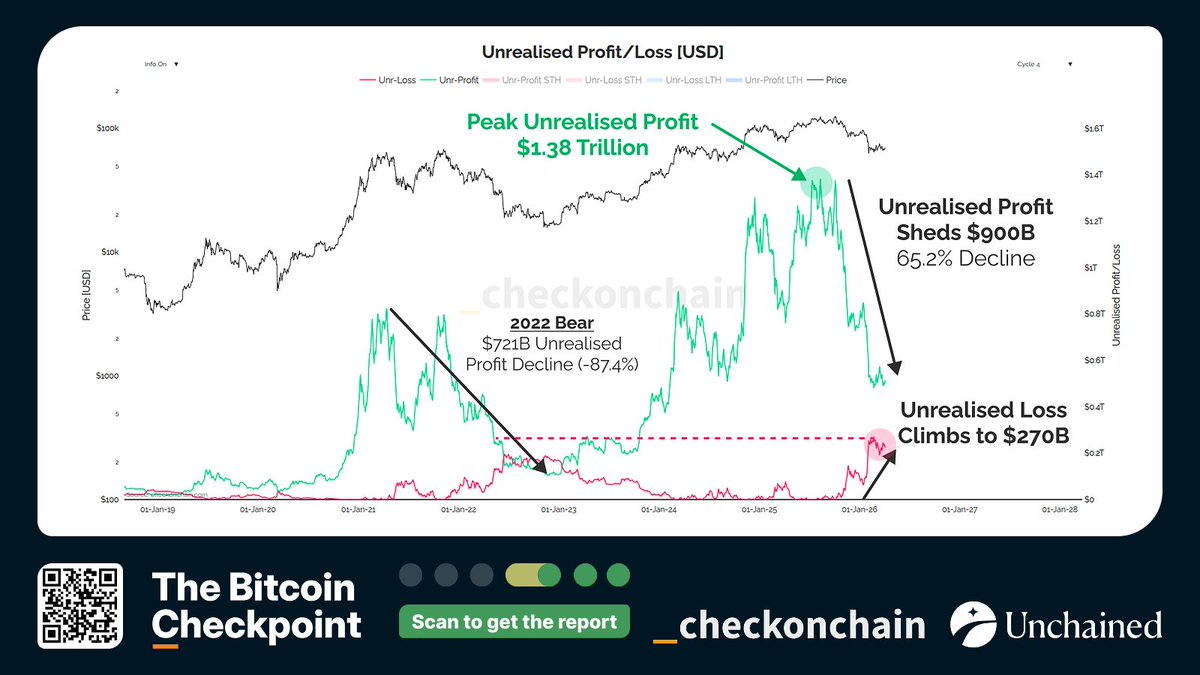
The deepest pain in Bitcoin bears often isn’t realised losses.
It’s watching enormous unrealised profits evaporate.
At the 2025 peak, Bitcoin investors collectively held $1.38T in unrealised profit.
By the Feb-2026 low:
• Unrealised losses hit a record $270B
• Unrealised profit had collapsed by ~$900B
That destruction of paper wealth is what drives fear, panic, and eventual capitulation.
The chart below tracks this shift in investor psychology in real time.
If you want to understand how this Bitcoin bear market actually unfolded beneath the surface, download The Bitcoin Checkpoint → https://t.co/Oa3FlKZrYa
Bitcoin bear markets tend to unfold in two stages.
First comes price-pain: sharp drawdowns that force overexposed investors to capitulate.
Then comes time-pain: long periods of sideways, exhausting chop that slowly wears down the remaining holders who lack conviction.
Historically, resilient bear market floors are formed only after a significant rotation of coins from weak hands into stronger hands at lower prices.
The chart below compares the current bear market structure with prior cycles.
If you want to understand how this Bitcoin bear market actually unfolded beneath the surface, download The Bitcoin Checkpoint → https://t.co/Oa3FlKZZNI
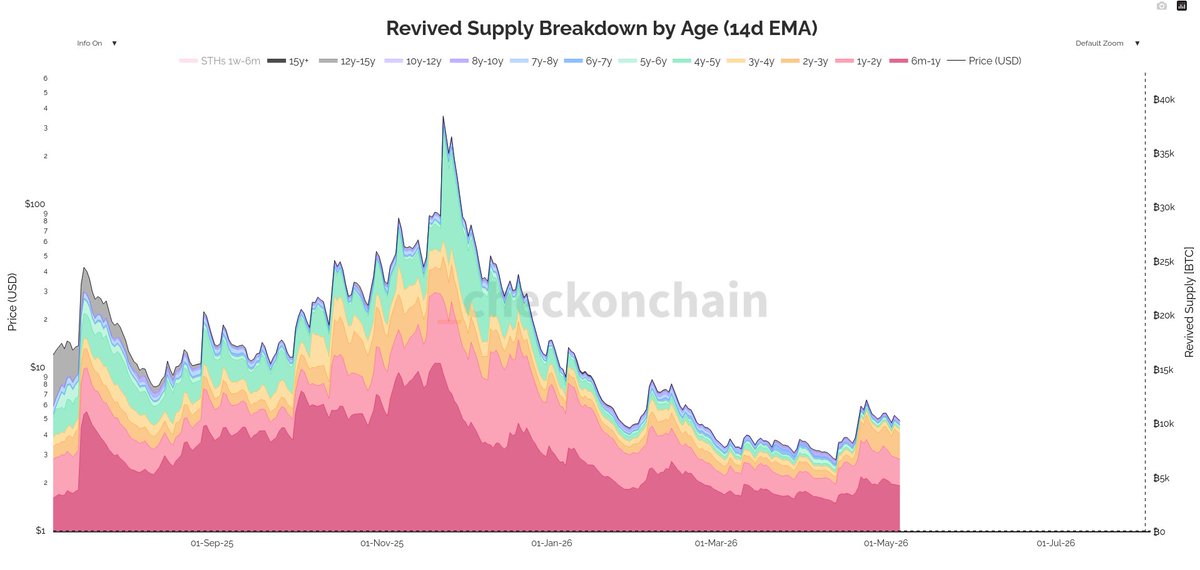
A major feature of the 2025-26 Bitcoin bear market was the scale of long-dormant supply returning to circulation.
Across 2024 and 2025, more than 1.3M BTC held for 5+ years were revived onchain, representing over $110B in rotated capital.
Historically, this type of behaviour tends to cluster around major cycle transitions, as experienced holders distribute supply into strong market demand.
The chart below shows just how large that wave of revived supply became throughout the cycle.
If you want to understand how this Bitcoin bear market actually unfolded beneath the surface, download The Bitcoin Checkpoint → https://t.co/Oa3FlKZZNI
Started checking this daily as probably the best indicator of if we sustain a rally or not.
Shout out to James @_Checkmatey_ for being THE BEST source of Bitcoin data and analysis, which allowed me to buy the bottom 1/5th of the chart.
He's a must follow.
Bitcoin’s rally into the mid $80ks has many bears questioning their thesis, especially as several key recovery signals are now starting to flip constructive. However, the road higher is unlikely to be smooth, and multiple major resistance zones still remain overhead.
In our latest newsletter piece, @_Checkmatey_ examines why the odds of the $60k low holding have increased meaningfully, and how investor psychology tends to evolve during the transition from late-bear to early-bull structure → https://t.co/WwIaCthtbV
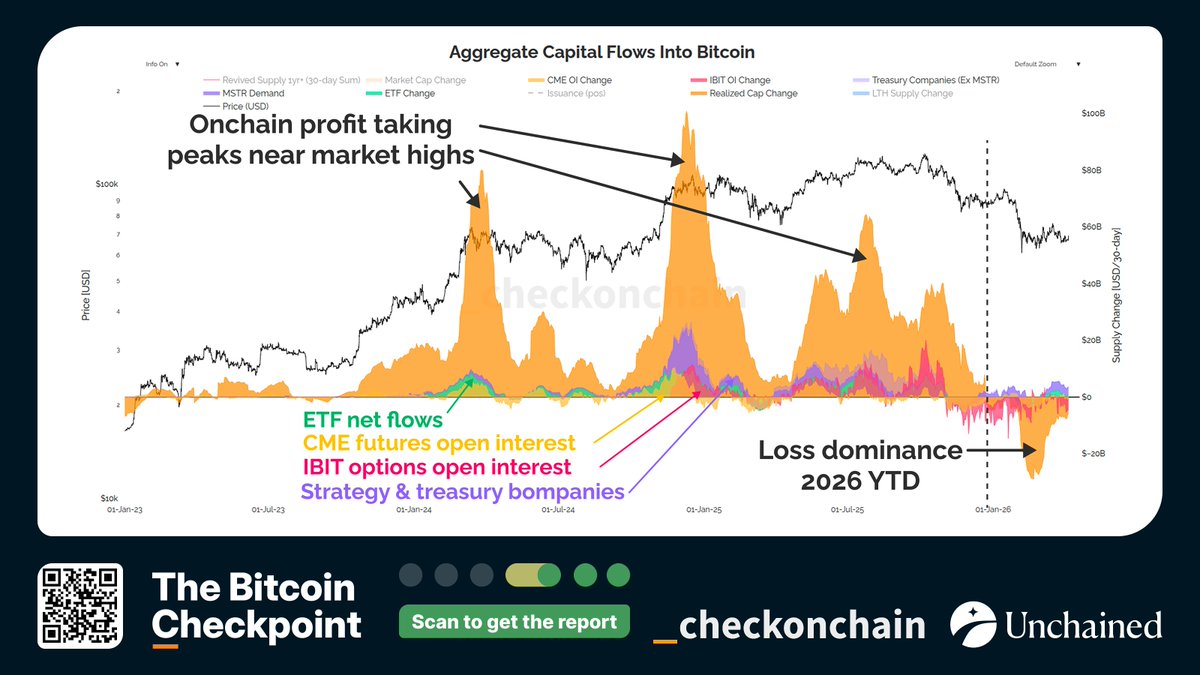
Everyone blamed derivatives, ETFs, market manipulation, or “suppression” for the 2025-26 Bitcoin bear market.
But the data points somewhere much simpler:
Old holders sold enormous amounts of spot BTC into strength.
Realised profits routinely reached $40B-$100B per month throughout 2025, materially outweighing ETF flows, futures positioning, treasury company accumulation, and options activity.
The chart below compares these capital flows side-by-side.
If you want to understand how this Bitcoin bear market actually unfolded beneath the surface, download The Bitcoin Checkpoint → https://t.co/Oa3FlKZZNI.
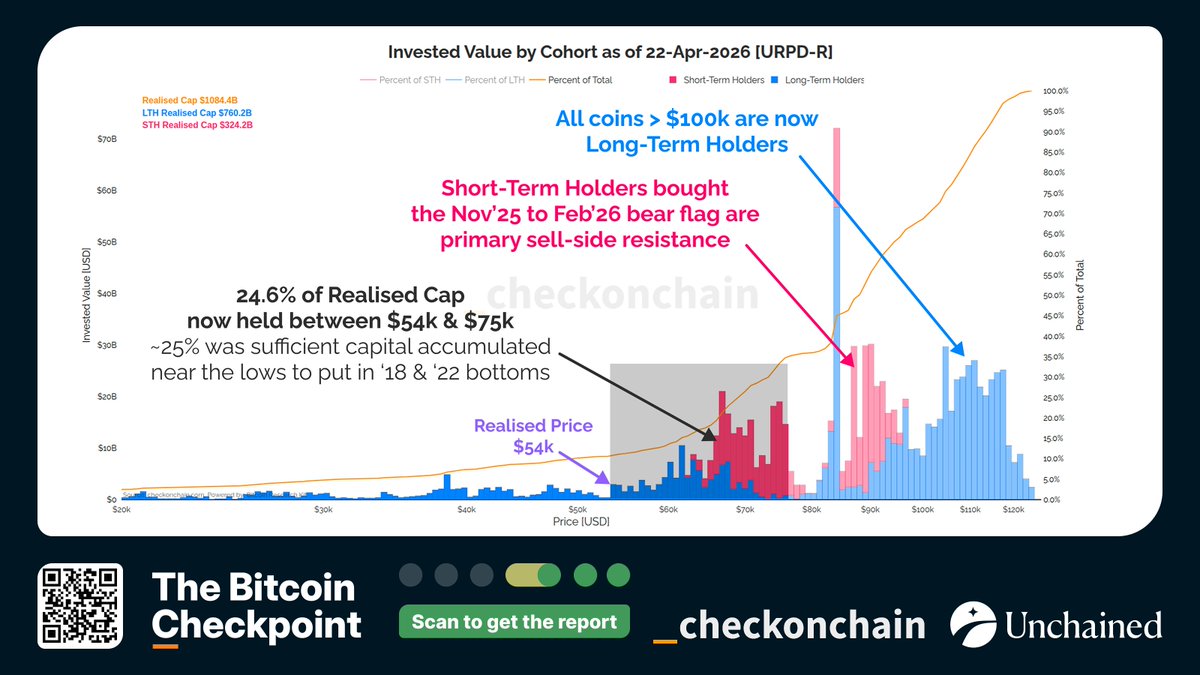
Bitcoin is testing the $80k region, where many expect a textbook bear flag breakdown. However, the structure has already deviated from typical bear flag behaviour, and the setup is becoming less clear-cut.
In our latest newsletter piece, @_Checkmatey_ examines why this may not be a true bear flag, and how to navigate the current “hardest phase” of the bear where both bulls and bears get tested → https://t.co/4A6zkG1oMw
Some insights explored in the piece:
- Typical bear flags resolve within weeks, but this structure has persisted for over 12 weeks
- Price is now pressing into the $80k–$85k zone, the first major line of bear resistance
- Around 28% of the Realised Cap has changed hands near the lows, exceeding prior bear floor thresholds
- Derivatives positioning remains heavily short, even as spot demand and ETF inflows strengthen
New Checkonchain Premium Q&A session is live.
In this one, @_Checkmatey_ and @_alecdj work through our subscriber's top-voted questions - from whether STRC introduces systemic risk to Bitcoin, to mining's pivot toward AI, the usefulness of the Power Law, and how to think about profit-taking with more conviction next cycle.
13 questions covered across macro, onchain, derivatives, and portfolio strategy.
Watch the full session → https://t.co/6saVNucvMm
I am very proud to publish the second edition of The Bitcoin Checkpoint report in partnership with @unchained.
It lays out my prevailing thesis for this bear market, how we got here, how low we may go, and what bottom formation looks like mechanically.
https://t.co/rHzK5PFDxH