Here's a tip for you, different ways of taking browser screenshots in DevTools 📸️
What do you think of this sort of 1 minute web development video? Would you like to see more of these?
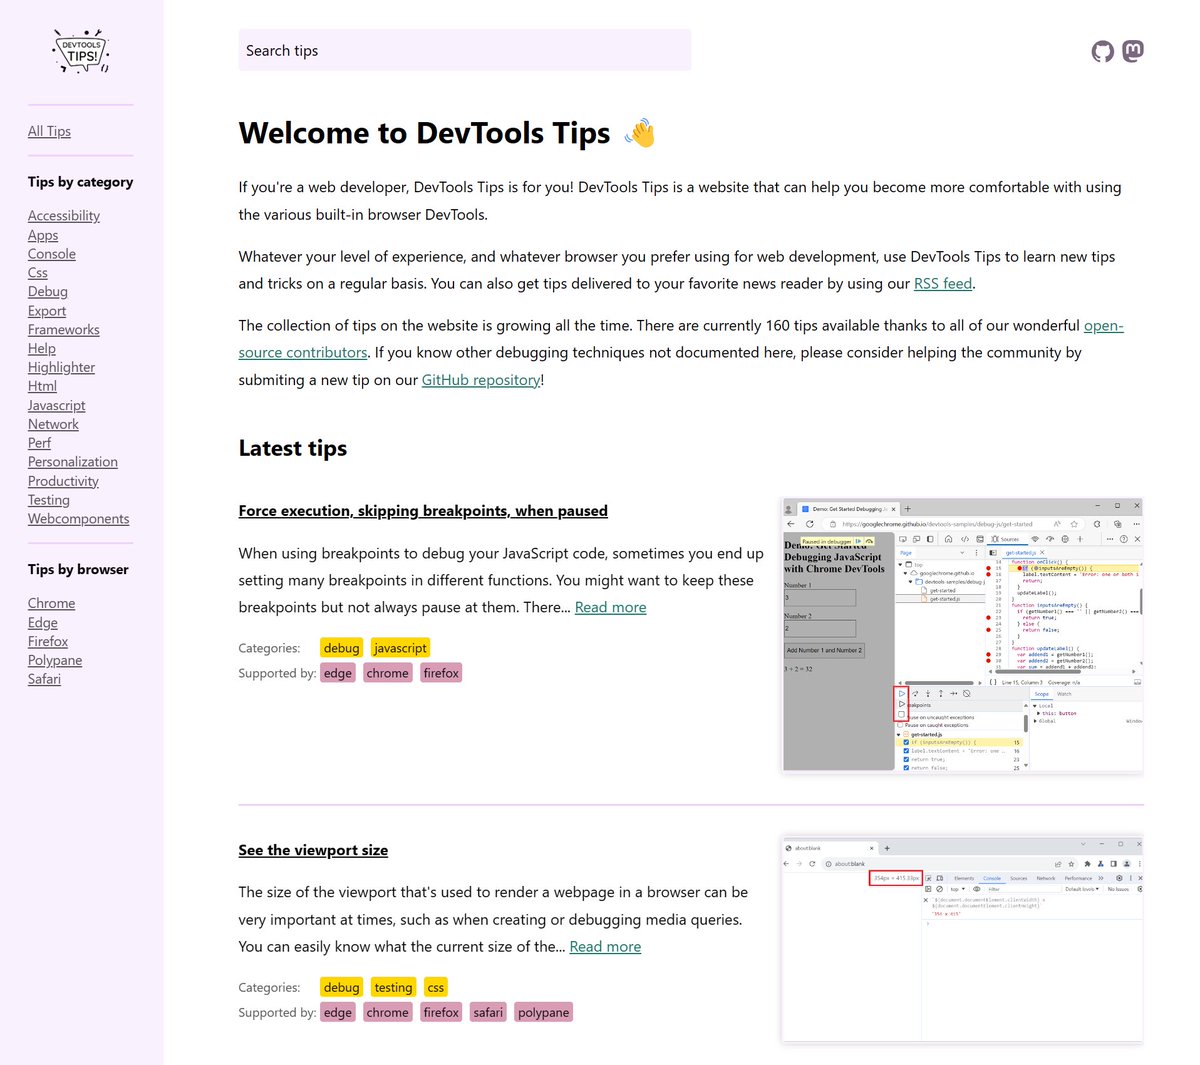
https://t.co/69c65PRSSl just got a face lift!
Now with:
✅ A home page that actually says what the site is about  ✅ A persistent sidebar to quickly access collections of tips. ✅ A persistent search field to find other tips.
Simulate color blindness
↳ @FirefoxDevTools
◆ In the "Accessibility" panel, from the toolbar open the "Simulate" menu and select the type of deficiency to simulate the page for the users with that deficiency.
→ https://t.co/jrFjUNYHFS
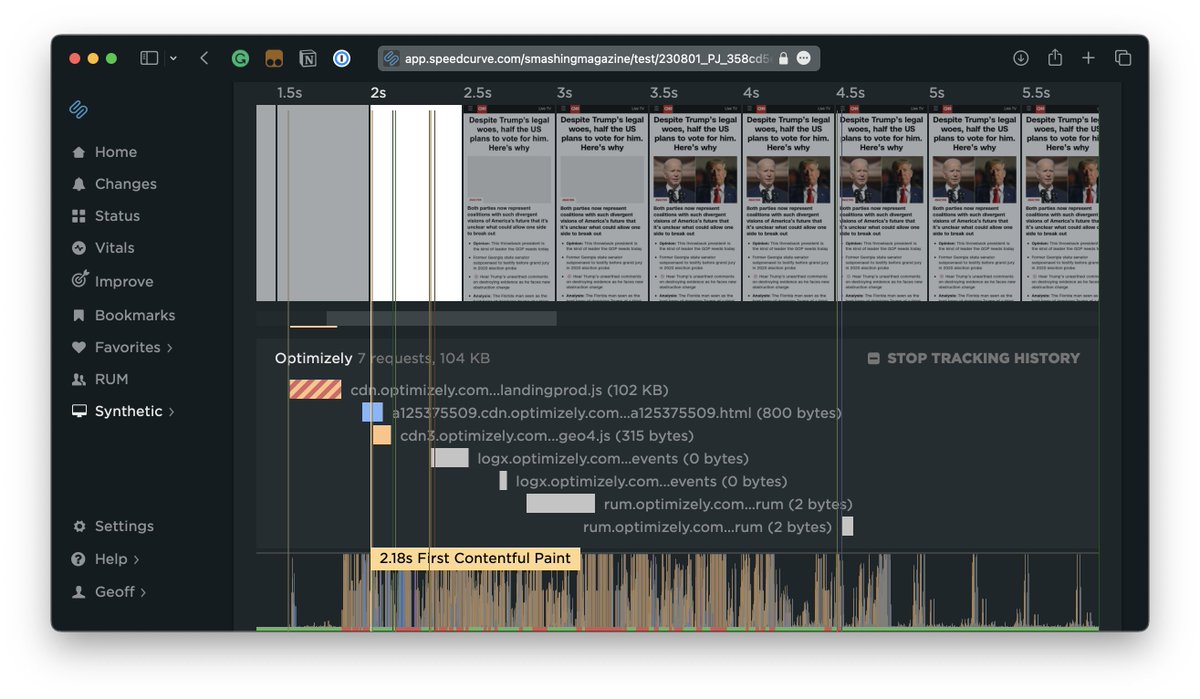
Having access to a free reporting tool like Lighthouse in DevTools is a great start for diagnosing performance issues by identifying bottlenecks on the main thread.
↬ Check out how @SpeedCurve can help you and your team dig deeper into the data: https://t.co/y3GvbcviSc
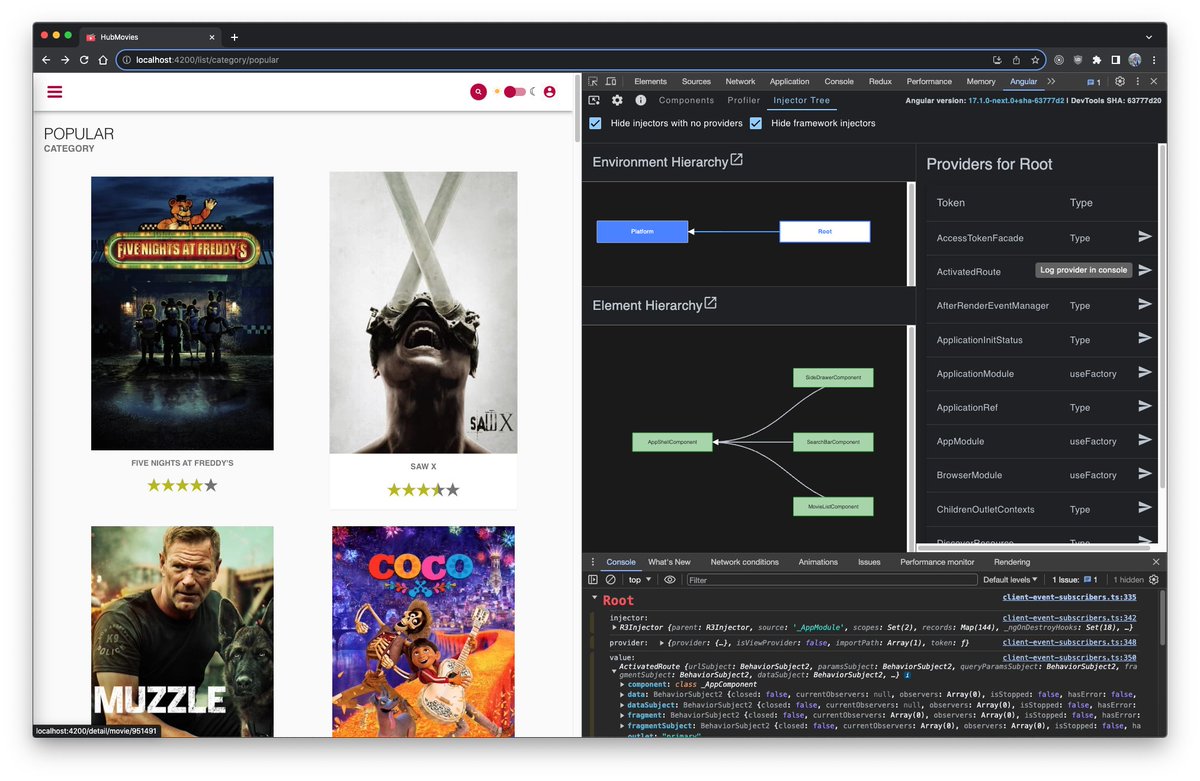
The new Injector Tree inspector is sooo cooool !
@alexbodurri is doing a wonderful job with the #Angular devTools !
In v17 we'll be able to inspect the injector hierarchy, check the available provider values.
It's great for debugging, great for learning 💪
Preview social media cards
↳ @polypane
◆ Open Info > Meta & scroll to Social media previews section. Works with localhost & you can overwrite domain with a click.
◆ Toggle light/dark buttons to preview the card in light and dark mode respectively.
🌐https://t.co/WZ4UriRwGI
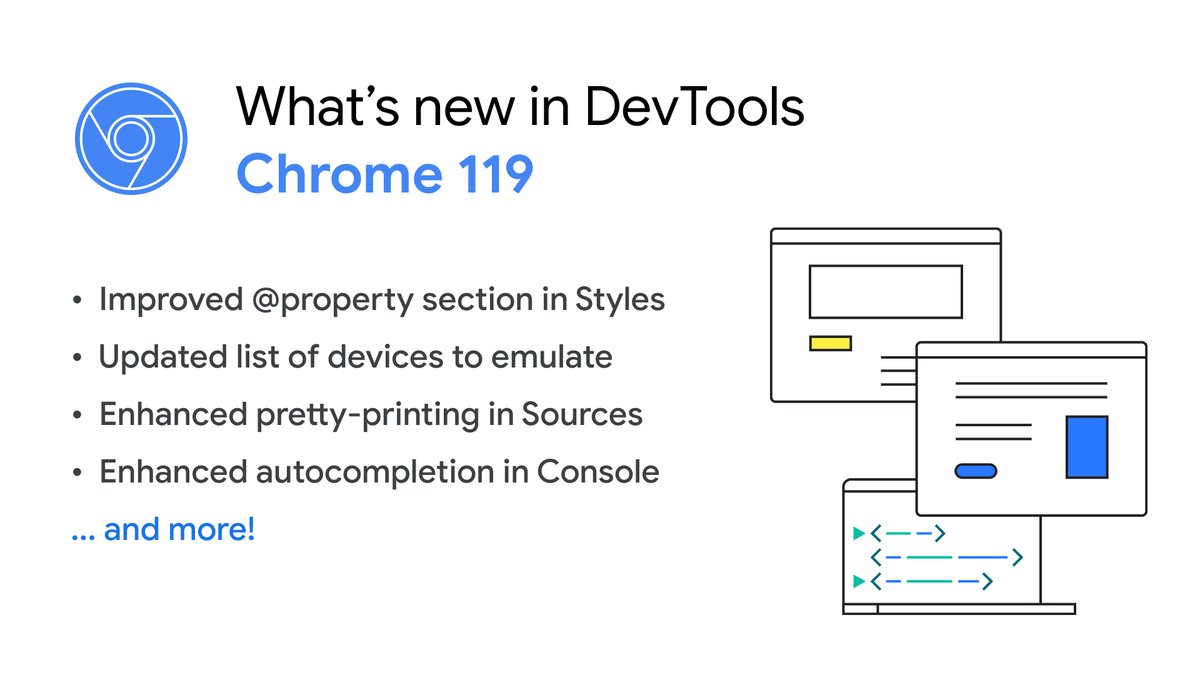
✨ Chrome 119 is here! What's New in DevTools?
- View CSS @property in the Styles pane
- Refresh the emulate devices
- Better pretty-print and autocompletion
...and more! 👇🏽
https://t.co/LLNktRjsAP
Spent hours debugging unwanted horizontal scrollbars?
@FirefoxDevTools shows directly in the inspector, which is the element with scrollbar and what are the overflowing elements 🤯
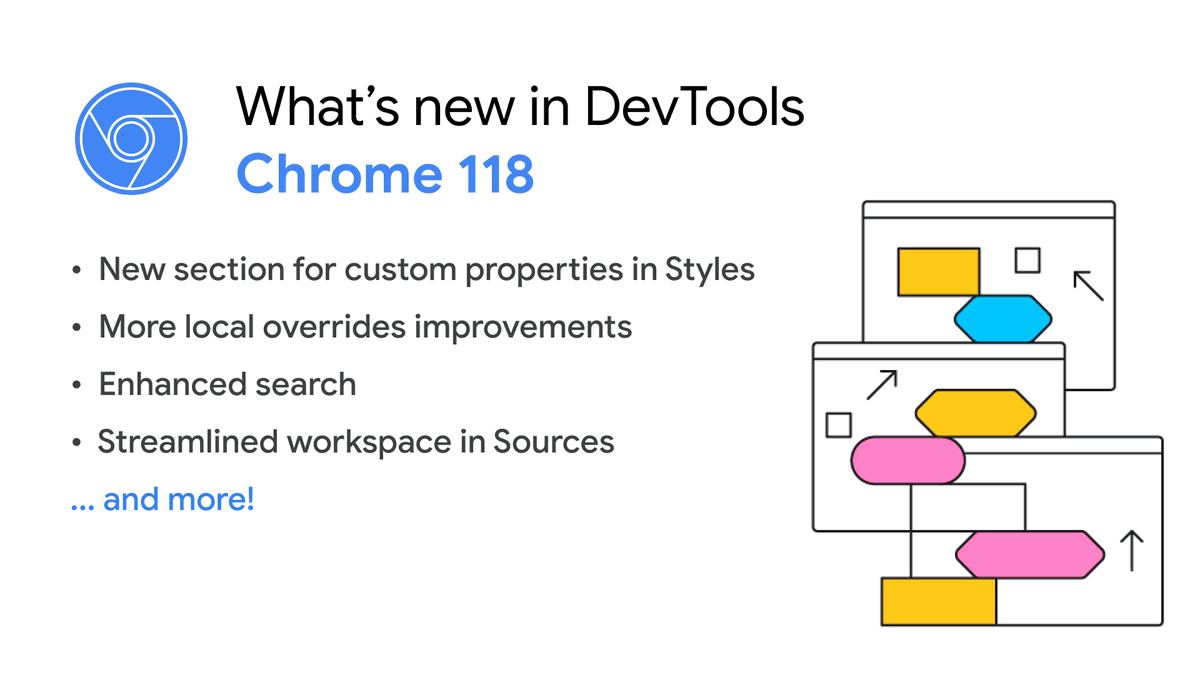
It's here! What's new in DevTools (Chrome 118)
🍋 Styles pane support CSS @property
😏 More local overrides improvements
🔎 Enhanced and faster search
📹 https://t.co/SbuZnOdu6S
📜 https://t.co/h0O9sLxZD4
Lighthouse v11.2 includes an overhaul to the performance category that focuses audit prioritization on estimated impact to the performance metrics. Also included is an upgraded score gauge. On hover, it visualizes how each performance metric affects the overall performance score.
Introducing the Crash Analyzer tool, improvements to the memory tool, and accessibility improvements in Microsoft Edge for Business🧠
Learn more about what else is new in DevTools 113 and 114: https://t.co/VJmI96kRxT
I’m extremely pleased to announce the release of Scroll-Driven Animations Debugger, a Chrome DevTools extension to visualize and debug Scroll-Driven Animations.
🔗 https://t.co/p7CyjLMblB
Get the extension from the Chrome Web Store and start inspecting https://t.co/yvZO8aij8f
📏 The current size of the viewport is kind of important to know about when debugging certain issues, or working on media queries.
💡With DevTools, you can easily see the viewport size!
https://t.co/yD2QxuB35g
New #DevToolsTip! "It works on my machine!" 😆 Let's see how @oliverdunk_ and @jecfish debug and fix their Chrome extension.
Watch 📹: https://t.co/NToSIFYjIq
By default, any changes you make in DevTools are not saved because they disappear after the page is reloaded. 💥
But Workspace can change that!
@jecfish has all the tips on setting up a workspace to ensure your changes are saved in your source code.
My face when I saw the new #ChromeDevTools 117 features. 🤯 Watch the highlight to learn more: https://t.co/OVaH0aZMX6
Mock API responses? 🙀 Hide Chrome extension requests? 🥷🏼 Debugging fetch priority? 📊
This update is so good it's got me feeling like 👇🏽
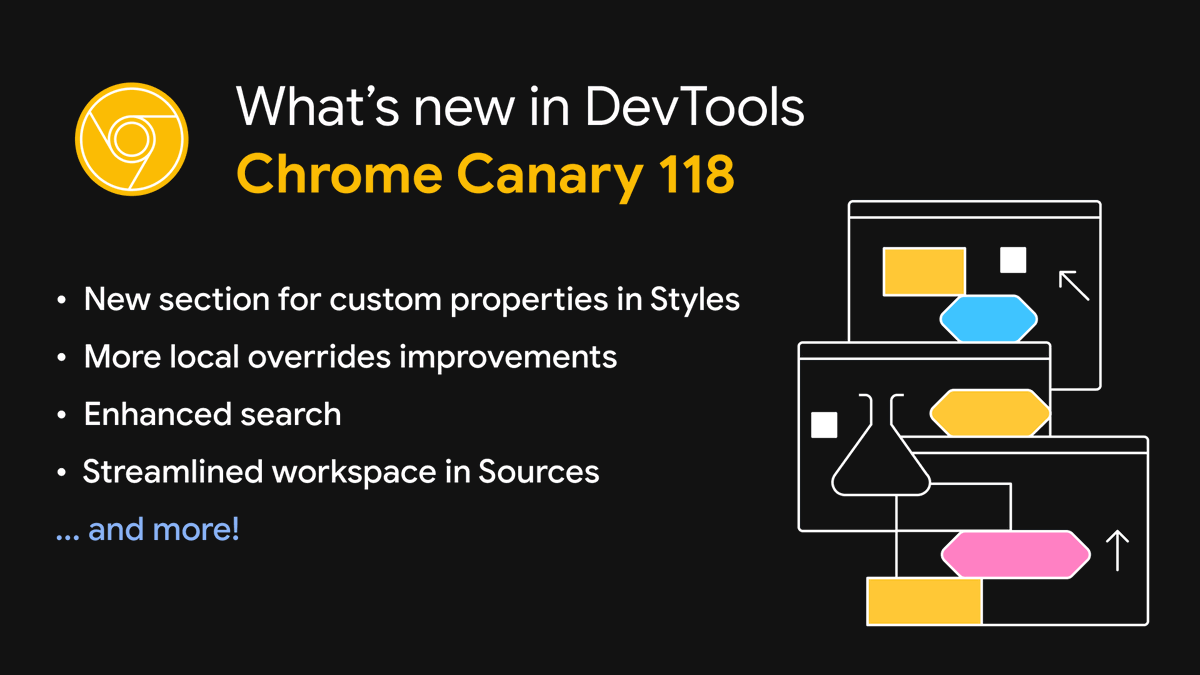
What's next in DevTools (Chrome 118)?
🪮 View CSS @ property
🎬 Filter overridden network requests
🔎 Enhanced search
... and more! Try them first in Chrome Canary.
https://t.co/h0O9sLyxsC