BREAKING: 🇺🇸 A US Treasury official says the government could use its General Account at the Fed to fund bond buybacks.
The Treasury currently holds around $935 billion in that account.
Unlike the original plan, this would not require issuing new debt to fund the purchases.
Drawing it down to buy bonds would inject cash directly into the financial system.
That is effectively money printing, not just a rearrangement of existing debt.
Historically that has been bullish for assets like crypto, gold and stocks.
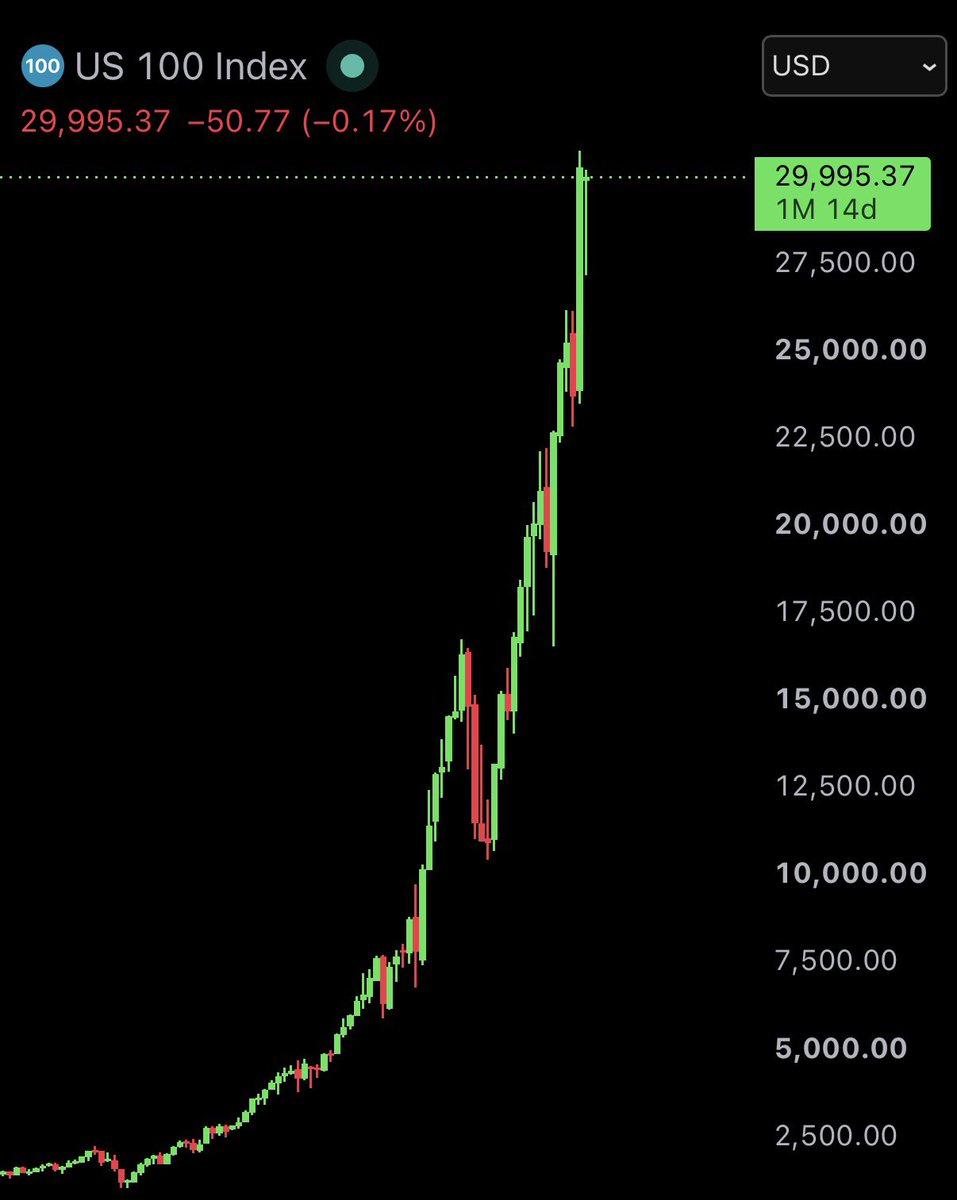
BREAKING: The Nasdaq 100 ETF, $QQQ, has attracted +$10.9 billion in inflows so far in August, now on track for its largest monthly inflow on record.
This is already more than double the +$4.9 billion recorded during the full month of July.
By comparison, the previous monthly record was set in March 2022, at +$9.2 billion.
Meanwhile, the semiconductor ETF, $SMH, has seen -$2.8 billion in outflows month-to-date, putting it on track for its largest monthly withdrawal on record.
At the same time, the software ETF, $IGV, has posted -$610 million in outflows so far in August, on pace for its 3rd consecutive monthly outflow.
Investors are rotating from semiconductors and software into the broader tech sector.
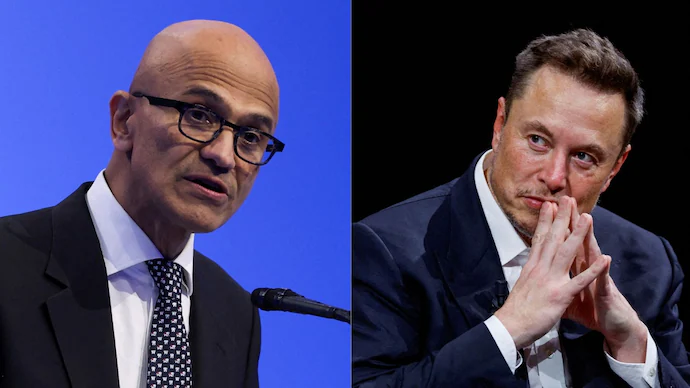
Elon is after Microsoft now!!
Cursor is planning to kill Github
Yesterday GitHub went down for 7 and a half hours. Website, Actions, Copilot, code merging, all of it. 15,000 developers reported outage.
GitHub's own CTO admitted they planned for 10x capacity and realized they needed 30x. They're now renting servers from AWS, Microsoft's biggest cloud rival.
Cursor launched Origin the same day.
S&P 500 ✨ Daily update:✍️
To the believers, the skeptics, my lovers and everyone in between… we have arrived at the ultimate flashpoint where price, time, and macro geometry collide.
Beyond its textbook elegance, this Rising wedge carries immense consequences. When the dust settles on this market cycle, this image will be remembered as the line in the sand that preserved the capital of those who chose to pay attention.
Navigating these treacherous waters and carrying the responsibility of guidance is a privilege I don't take lightly. Decades of surviving and thriving in these markets have honed my ability to translate these complex market hieroglyphics. It is an uncanny knack for pattern recognition, driven by a deep respect and humility for what the tape is revealing.
Today's price action proves the primary rising wedge on the SPX is executing exactly to script. Call it a playbook setup, call it clockwork ..the reality is undeniable.
The index is officially running out of real estate. We are moving toward the apex, bringing us face to face with the ultimate moment of truth. By nesting the micro intraday frames within the macro multi month cycles, the warning signs become blindingly obvious. The overarching, inherently bearish ascending structure is ringing a major alarm at the highs, perfectly synchronising with the smaller rising wedge.
For your private perusal…
Enjoy.
✨Yours truly,
The Great Martis.
She's beautiful.
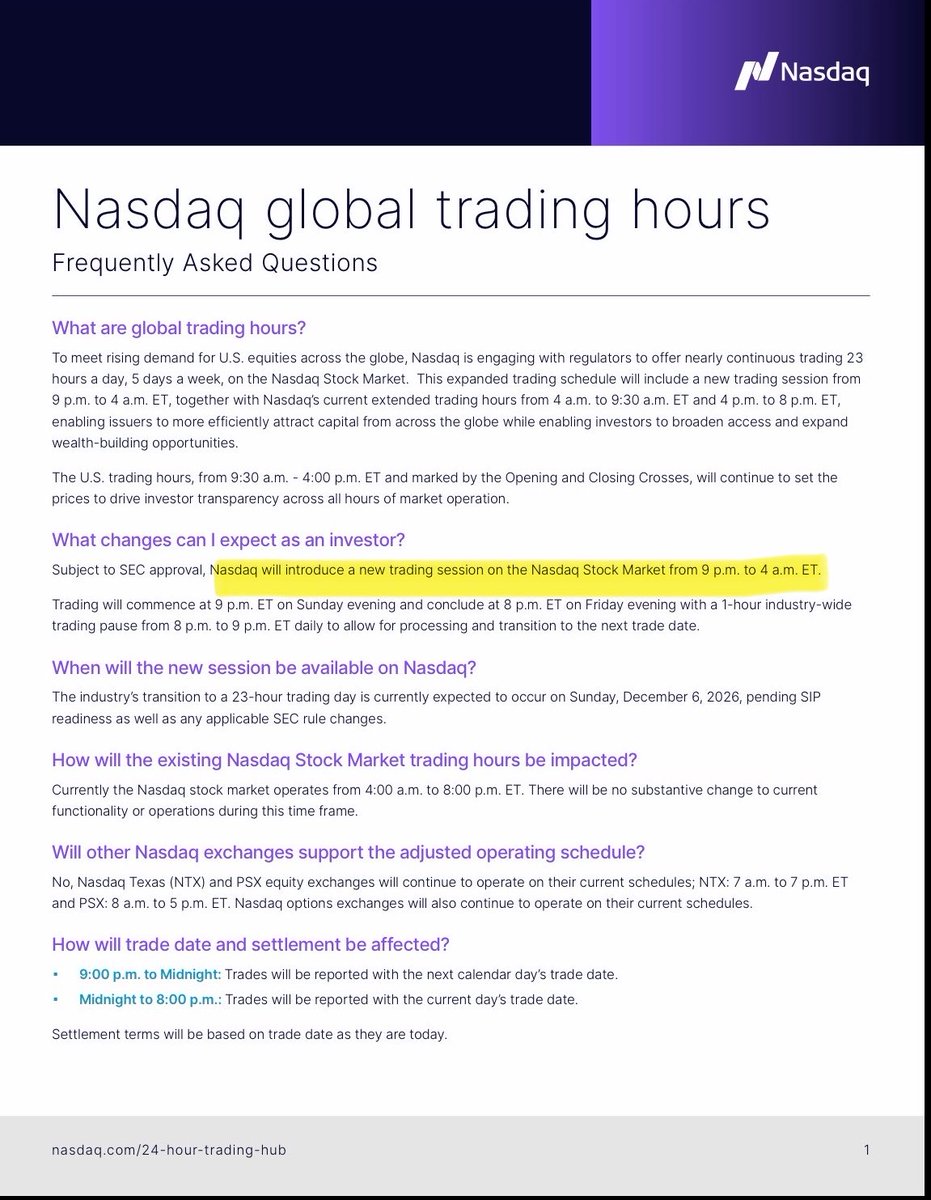
BREAKING: 🇺🇸 Nasdaq to launch overnight stock trading from 9 pm to 4 am ET starting December 6, 2026.
Nasdaq plans to offer continuous trading for nearly 23 hours a day, five days a week.
The bearish projection looks flawless. The Fed hikes at the exact top, triggering a modeled S&P 500 bleed to $4,835 by 2028.
The flaw is assuming static policy. A drawdown of that size forces the exact rate cuts that would invalidate the dashed line long before it hits.
🚨 THE SAME CATALYST THAT CAUSED THE OCTOBER 10 CRASH IS BACK.
MSCI has brought back the proposal that would remove Michael Saylor's Strategy from every major global index.
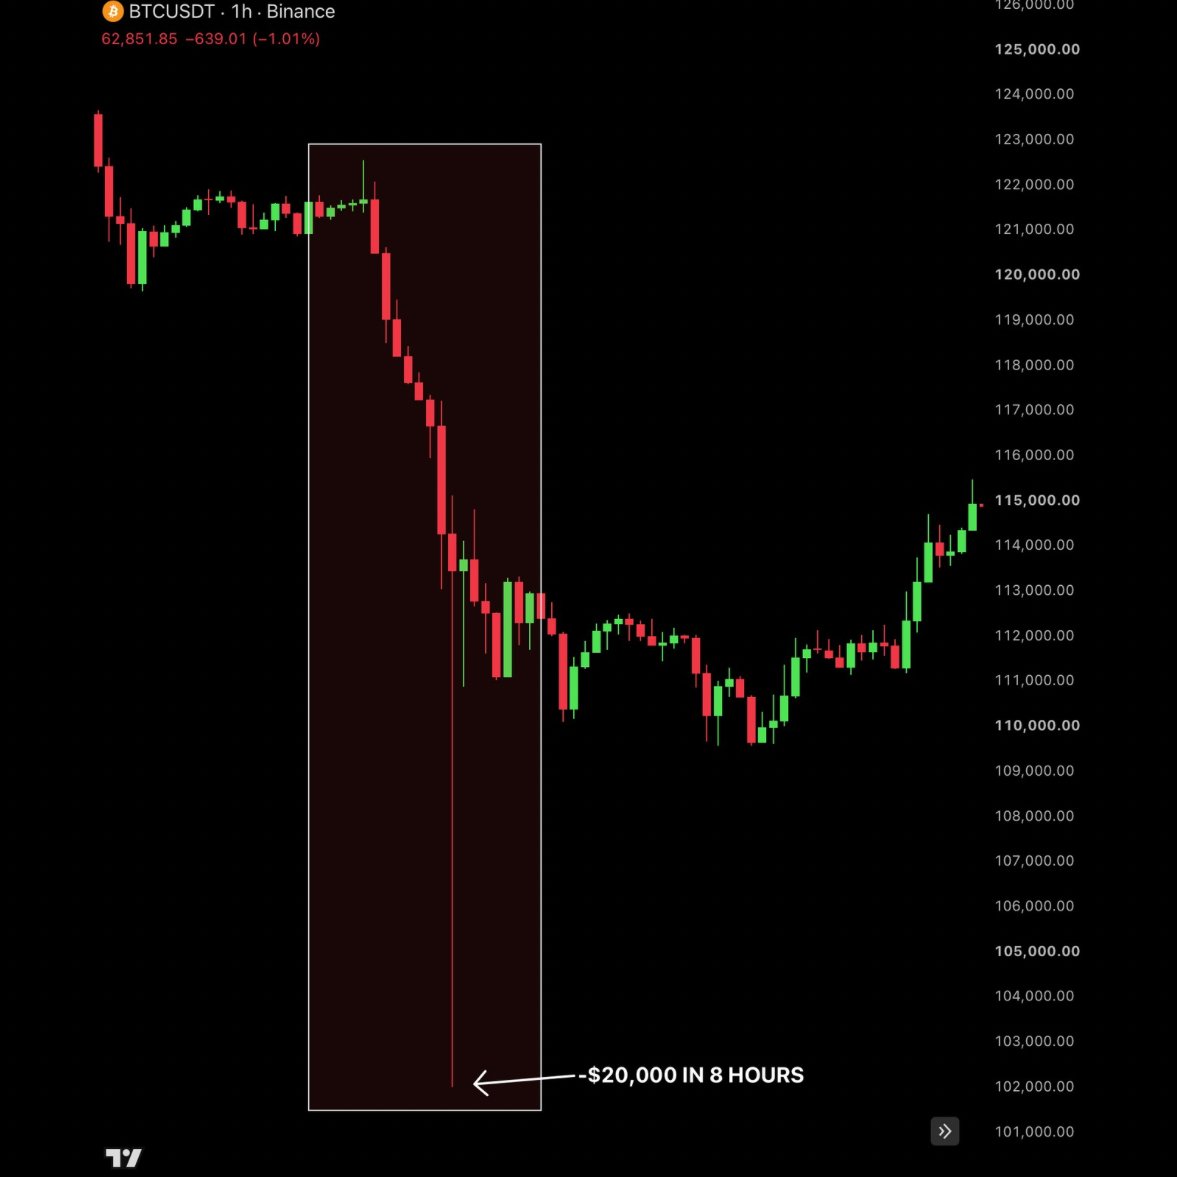
The first time it did this, on October 10, Bitcoin dropped roughly $18,000 in one day and over $20 billion in liquidations happened.
MSCI wanted to remove any company holding 50% or more of its assets in crypto, and since MSCI indexes decide where trillions of dollars of passive money sits, funds started pricing in forced selling immediately.
MSCI dropped that plan in January after Strategy argued the crypto specific rule was arbitrary and unfair.
The new proposal fixes that. It does not target crypto at all.
MSCI has created a category called Non-Operating Companies. These are companies that make money by holding assets instead of running a business.
The first check is simple. If more than half of a company's assets are used to actually run a business, it stays in the index. If not, MSCI runs five more checks: how much it spends on operations, whether it burns cash, how much of its value swings with asset prices, and how much it depends on raising outside money to keep buying more assets.
Fail four out of those five and the company is removed.
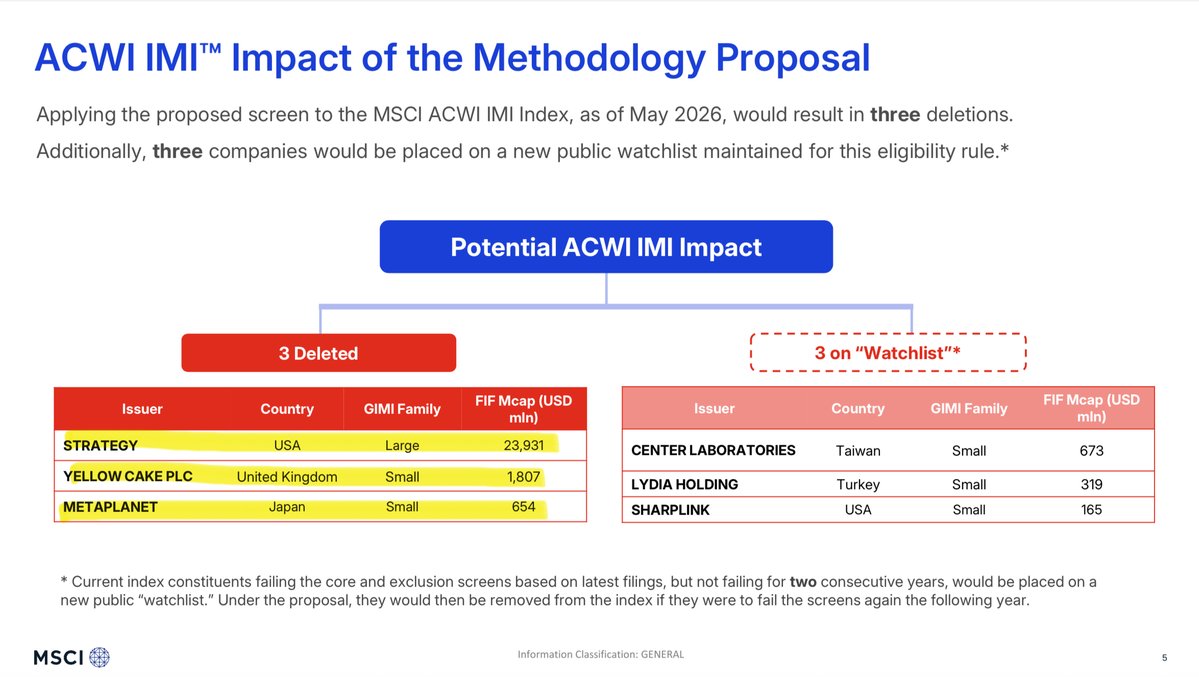
MSCI already tested the rule on its main global index, ACWI IMI, using data from May this year. Strategy failed. So did Metaplanet and uranium holder Yellow Cake.
SharpLink is one step behind them. It failed the test once, and one more failure next year removes it too.
That is the problem for Saylor. His entire defence last time was that MSCI was targeting crypto. He cannot use that when a uranium company fails the same test.
If it passes, every fund tracking MSCI has to sell Strategy on the same day. JPMorgan put that number at $8.8 billion when it modelled the October version.
The scariest chart on the planet isn’t the parabolic hyperscalers going vertical… it’s the 10yr bond – the quiet, boring old benchmark that can quietly nuke the entire risk-asset party.
And it’s just broken out of its majestic yet consequential symmetrical triangle that’s been coiling for years.
As the old technical adage goes: the bigger and tighter the coil, the bigger the move. Measurement puts this pattern topping out at 6.5%… more than enough to nuke the entire US and global markets and everything else that’s attached to it.
For one's private perusal.
Enjoy.
A major, pivotal turning point is approaching for oil.
This disruption is set to last for years and will steer global economies toward the rare phenomenon of stagflation.
Oil is not the only commodity about to ignite inflation.
The current, insignificant ebbs and flows are just part of a much larger process that is fermenting.
This not good; this very bad.
For one's private perusal..
Enjoy.
🔥 "Can Individual Investors Beat the Market?" Paper increíble. El retail no es todo igual: copiando al 20% con mejor historial y shorteando al 20% peor, el paper obtiene 7.48% anual de alpha
Coval, Hirshleifer y Shumway estudian las operaciones de 63652 hogares en 115856 cuentas de un gran broker entre 1991 - 1996
La pregunta es simple: cuando un inversor individual gana, ¿tiene skill o simplemente tuvo suerte?
Para separar ambas cosas, en varios tests exigen al menos 25 operaciones durante la primera mitad de la muestra, clasifican a los inversores por su performance pasada y después observan qué ocurre con sus nuevas operaciones en la segunda mitad
Miden los retornos desde después de ejecutar cada compra para evitar que el resultado sea simplemente el costo o impacto inmediato de la propia operación
Y ajustan los retornos por:
- Market
- Size
- Value
- Momentum
- Características de cada acción como tamaño, book-to-market y momentum
Alpha (retorno que queda después de ajustar por esos factores) mostró una diferencia enorme entre los extremos
Durante los 5 días posteriores a una compra:
- Top 10%: 0.106% de alpha
- Bottom 10%: menos 0.475%
- Diferencia: 0.580%
Con el ajuste alternativo por características, la diferencia fue 0.551%
Lo importante es que el ranking se construye con información de la primera mitad de la muestra y el resultado se mide después
No están mirando retrospectivamente quién ganó y llamándolo hábil
Cuando extienden el horizonte aparece el mismo patrón
Los inversores son ordenados por su performance ajustada durante la primera mitad y después se estudian las posiciones que compran en la segunda
El top 10% obtuvo 3.379% por encima de una cartera de acciones con características similares
El bottom 10% obtuvo 0.238%
La diferencia fue 3.141% por posición
Como los holding periods (tiempo que mantienen la posición) rondaban los 6 meses, los autores interpretan el resultado del grupo superior como cerca de 6% anual de outperformance
Después hacen una prueba todavía más interesante: ¿alguien que observa estas operaciones podría convertir esa persistencia en una estrategia?
Al finalizar 1993 clasifican a los inversores según su performance de los 3 años anteriores
Entre 1994 - 1996 construyen una cartera que:
- Replica las posiciones del 20% con mejor performance previa
- Shortea las posiciones del 20% con peor performance
- Excluye el tercio de acciones más chicas
- Mantiene las posiciones siguiendo las operaciones de esos inversores
El long-short (comprar un grupo y vender en corto el otro) produjo un alpha anual de 7.48% después de ajustar por market, size, value y momentum
El resultado además estuvo impulsado por la buena performance de los inversores previamente exitosos, no solamente por shortear a los malos
Y no parece explicarse simplemente por acciones pequeñas o información privada
Los autores muestran que la persistencia no está confinada a small caps ni a empresas que el mismo inversor ya había operado antes
Cuando eliminan compras repetidas de una misma acción, el efecto se debilita, pero sigue siendo estadísticamente significativo
Tampoco encuentran que los mejores inversores simplemente estén explotando PEAD o actuando sistemáticamente como proveedores de liquidez
La interpretación es más incómoda para la idea de que todo el retail es igual: una minoría parece tener skill persistente para seleccionar acciones, mientras otro grupo pierde de manera igualmente persistente
El paper no puede determinar con certeza si esa ventaja viene de explotar ineficiencias, procesar mejor información pública o capturar risk premiums (compensaciones por asumir determinados riesgos) que los modelos no miden bien
Las limitaciones importan:
- Los datos vienen de un solo broker
- La muestra termina en 1996
- Muchos tests se concentran en inversores suficientemente activos
- El 7.48% no es un retorno neto después de costos reales de implementación
- La estrategia tiene un turnover (porcentaje de la cartera que se renueva) máximo estimado de 128% anual
- Los autores argumentan que costos razonables no eliminarían el resultado, pero no ejecutaron esa cartera en tiempo real
- Diseñan los tests para reducir survivorship bias, aunque reconocen que podría inflar la magnitud del retorno de la estrategia
- Nada de esto demuestra que el mismo alpha siga existiendo hoy
El inversor individual promedio puede seguir teniendo malos resultados y, al mismo tiempo, existir un grupo pequeño con skill real
Promediarlos a todos borra justamente la parte más interesante del paper: la distribución de habilidad importa mucho más que el promedio del retail
Link al paper en el primer comentario
THIS IS INSANE.
Japan has reportedly spent around $160 billion this year trying to stop the yen from falling.
- $73 billion in April and May, a record monthly total at the time.
- $53 billion last Thursday, likely the largest single day in its history.
- $34 billion last Friday.
Every time, the yen strengthens for a few days and then goes right back.
Japan cannot fix this by spending reserves. It can only fix it by raising rates agressively.
this hedge fund secret is f*cking insane
the entire framework just got compressed into a 12 page PDF.
Columbia University released the complete Black-Scholes model framework, the exact one quants at firms like Jane Street and Two Sigma are known to run, and put it out for free.
the crazy part is this isn't a watered-down summary, it's the actual mechanics behind pricing models used on live desks right now.
most people assume this stuff stays locked behind institutional walls.
this one hands you the framework directly.
bookmark and read this before someone takes it down.
🦔Leopold Aschenbrenner's hedge fund Situational Awareness just got forced out of all its public holdings after margin calls from Bank of America, Goldman, and JPMorgan. The fund hit $45 billion at the start of July. His biggest bets were SK Hynix, Nebius, SanDisk, Micron, and CoreWeave, all down more than 35% this month. His shorts on software names like Adobe went against him too. Citadel bought the bulk of what was left. He's 25 years old.
My Take
Aschenbrenner wrote the essay series that became the intellectual blueprint for the AI infrastructure trade. Massive expansion of chips, memory, data centers, power. He was probably right about the demand. He just needed it to arrive before his margin calls did, and it didn't. When both sides of your book move against you at once, longs down and shorts up, there's no way out. His prime brokers sold for him.
He named the fund after the ability to see what's coming, and got margin-called because he didn't see the turn. $200 million into $45 billion in two years, given back in a month. Korea liquidated 75% of its leveraged positions this month. Now Wall Street funds are getting the same calls. The AI infrastructure thesis might be right over the long run, but a leveraged fund has to survive until then, and his didn't.
Hedgie🤗
this paper is f*cking insane
a HKUST paper built a model that detects market crashes by watching correlations collapse across 24 assets
the result: 1.13 Sharpe with 15.6% CAGR and -7.5% max drawdown vs 3.7% CAGR and -33.7% drawdown for buy & hold
the crazy part is it does not wait for volatility to spike
it sees diversification disappearing before the crash hits
bookmark before this thread gets buried
BREAKING: An upcoming "super" El Niño is expected to wipe out $3.1 trillion from the global economy.
The last time an El Niño this strong hit, in 1876-78, it triggered a global famine that killed more than 50 million people, including 9.5 million in China and 6.1 million in India.
Experts say the same death toll isn't likely to repeat today.
But the underlying weather pattern is the same one: drought across large parts of Asia, heavy destructive rains across South America, hitting harvests on two continents at once.
PIIE estimates the last comparable modern event, the 1997-98 Super El Niño, would cause $686 billion in immediate global losses if it repeated today.
Africa alone is projected to lose $10-20 billion this time, according to the African Development Bank, with maize prices expected to double as crops fail across the continent.
India, the world's largest rice exporter, is bracing for its weakest monsoon in over a decade, a monsoon that normally supplies 70% of the country's total rainfall.
When the world's biggest rice exporter grows less rice, rice gets more expensive everywhere, landing on a world where food and energy prices are already elevated from the ongoing war.