With the last trading day of May done: S&P 500 market cap stands at $67.86T, up $6.46T (+10.5%) since YE 2025. That's 213% of US GDP (up 18 pp).
The top-10 companies by market cap make up 41% of the capitalization — an unprecedented concentration by historical standards. They added $2.84T (+11.45%) to their market cap since YE 2025.
Full analysis: https://t.co/KCvpzdcV3l
#SP500 #Markets
🇪🇺 Eurozone Q1 GDP growth came in at +0.62% YoY.
Services sectors drove growth while industry dragged:
Top positive contributions:
• Wholesale & retail trade: +0.28 pp
• Information & communication: +0.22 pp
• Public admin, defence & education: +0.21 pp
• Real estate: +0.20 pp
• Professional & scientific activities: +0.17 pp
Industry (excl. construction) subtracted 0.47 pp.
See the full breakdown in the chart below 👇
📊 Notebook: https://t.co/DZN42abCAO
#Eurozone #GDP
No meaningful shifts in #Eurozone risk-free #InterestRates (derived from traded AAA-rated govt bonds) in May 2026 vs April:
• Short-term (<3y): 2.46% (+3 bp)
• Long-term (>3y): 3.34% (+3 bp)
The curve remained very steady in the absence of major ECB or government announcements.
Full analysis: https://t.co/VG29WyBtAu #Finance #ECB
🇪🇺#Eurozone inflation accelerating sharply in May!
Headline HICP rose to 3.2% YoY (from 3.0% in April) — still well above the ECB’s 2% target.
The 3-month annualized rate (Mar–May) hit a whopping 10.1%. No wonder the #ECB this week hiked its policy rate by 25 bp to 2.25%.
German 10y Bund yield: 3.00% → 3.05%
Italian 10y: 3.82% → 3.84%
Notebook + data + code:
https://t.co/VG29WyBtAu
#HICP #Inflation
🇪🇺 Real wages in the Eurozone are still growing — but the pace is slowing.
Analysis of Eurostat data shows real hourly wage growth (nominal earnings minus consumer price inflation) eased to ~0.7% YoY in Q1 2026, down from 1.4% previously. It remains positive and above its historic average of ~0.3%, but is now lagging real GDP growth (~1.1%).
A positive sign for productivity and contained unit labour costs.
See the chart below for the full picture 👇
Full analysis + notebook: https://t.co/VG29WyBtAu
#Eurozone #RealWages #Wages
🇪🇺#Eurozone inflation accelerating sharply in May!
Headline HICP rose to 3.2% YoY (from 3.0% in April) — still well above the ECB’s 2% target.
The 3-month annualized rate (Mar–May) hit a whopping 10.1%. No wonder the #ECB this week hiked its policy rate by 25 bp to 2.25%.
German 10y Bund yield: 3.00% → 3.05%
Italian 10y: 3.82% → 3.84%
Notebook + data + code:
https://t.co/VG29WyBtAu
#HICP #Inflation
With actual CPI at 4.2%, markets now expect inflation to cool to ~3.0% over the next year (Cleveland Fed data as of June 10).
Two years out, expectations fall to ~2.5%. After mid-2028 the curve stabilizes around 2.4%.
Near-term expectations have edged lower vs a month ago, but the long end remains well above the Fed’s 2% target.
#InflationExpectations #CPI
Fresh US CPI data — May 2026
Consumer price inflation accelerated to 4.2% YoY — significantly above the Fed’s 2% target.
The 3-month annualized rate (Mar–May) jumped to 8.2%.
This is the highest inflation reading since April 2023.
Full charts, data & code: https://t.co/ptr4NQReWT
#CPI #Inflation #Economy
US job vacancy data shows unfilled positions rose by 731K in April, pushing the job-vacancy rate to 4.48%, and vacancies per unemployed declined to 1.01. Both metrics remain well above their long-term averages, indicating a still-tight US job market.
🔎 Full analysis and terminology: https://t.co/1onDiEHzpC
#vacancies
May unemployment data shows little change from April: the labor force participation rate (the % of the population working or looking for work) held steady at 61.8% (see first graph), while the unemployment rate remained at 4.3%.
What stands out is that 1.5 percentage points fewer Americans are participating in the labor market compared to pre-pandemic levels — and 2.2 pp below the 21st-century average. The flip side? Those who are in the labor force are enjoying a stronger job market than the historical norm: 4.3% unemployment vs. the century average of 5.7%.
🔎 Full analysis: https://t.co/1onDiEI7fa
#Unemployment #JobMarket #Economy #LaborForce
Since the start of the Fed’s Reserve Management Purchases (RMP) in Dec 2025, the balance sheet has expanded by +$82B.
Breakdown (since 2025-12-01):
• US Treasuries: +$234B (mainly T-bills)
• Mortgage-Backed Securities: -$74B (ongoing runoff)
• Loans: -$3B
• Repurchase Agreements: -$74B
Net result: A clear but measured shift from QT → modest balance-sheet growth to keep reserves ample and stable (~10% of GDP).
🔎Full analysis: https://t.co/nEBqlMpvFA
#Fed #BalanceSheet #RMP #MonetaryPolicy
The Fed’s latest May 2026 data shows Reserve Management Purchases (launched Dec 2025) are in full swing. Changes in May:
• Treasuries: +$36B
• Mortgage-Backed Securities: -$16B
The bigger picture: after years of QT, the Fed quietly reversed course in December (see 2nd chart). RMP is now the main driver of balance-sheet expansion to keep reserves ample.
#Fed #BalanceSheet #RMP #MonetaryPolicy
May unemployment data shows little change from April: the labor force participation rate (the % of the population working or looking for work) held steady at 61.8% (see first graph), while the unemployment rate remained at 4.3%.
What stands out is that 1.5 percentage points fewer Americans are participating in the labor market compared to pre-pandemic levels — and 2.2 pp below the 21st-century average. The flip side? Those who are in the labor force are enjoying a stronger job market than the historical norm: 4.3% unemployment vs. the century average of 5.7%.
🔎 Full analysis: https://t.co/1onDiEI7fa
#Unemployment #JobMarket #Economy #LaborForce
US Risk-Free Rates – Changes in May
1. Futures markets now expect the Fed funds rate in June '27 at 3.88% (+13 bp from a month ago). This implies one additional 25 bp policy rate hike is now priced in by June 2027.
2. Spot 10y Treasury yield: 4.48% (+16 bp)
3. Forward 10y Treasury yield in June 2027: 4.58% (+3 bp)
Full analysis here: https://t.co/Xe8pdkSH5K
#Fed #FOMC #InterestRates #MonetaryPolicy
With the last trading day of May done: S&P 500 market cap stands at $67.86T, up $6.46T (+10.5%) since YE 2025. That's 213% of US GDP (up 18 pp).
The top-10 companies by market cap make up 41% of the capitalization — an unprecedented concentration by historical standards. They added $2.84T (+11.45%) to their market cap since YE 2025.
Full analysis: https://t.co/KCvpzdcV3l
#SP500 #Markets
In the three months to April PCEPI rose at an annualized rate of 6.0% (CPI rose at a pace of 7.3% in the same three months). Higher oil prices are feeding into other costs…
The Fed’s preferred inflation gauge (PCEPI) just hit 3.8% YoY in April — matching CPI and the highest since mid-2023. Still well above the Fed’s 2% target.
Yet markets expect the Fed to hold rates at 3.50%-3.75% during its June policy decision.
Real short-term rates are basically zero while inflation is running hot. History isn’t kind to this setup.
Full analysis + long-term charts here:
https://t.co/ySCLoeAr1F
#Inflation #Fed #PCE #MonetaryPolicy
🇺🇸 Fresh US CPI data — April 2026:
Consumer price inflation accelerated to 3.8% YoY — significantly above the Fed’s 2% target.
The 3-month annualized rate (Feb–Apr) rose to 7.3%.
Full charts, data & code in the Jupyter notebook:
https://t.co/ptr4NQRMMr
#CPI #Inflation #Economy
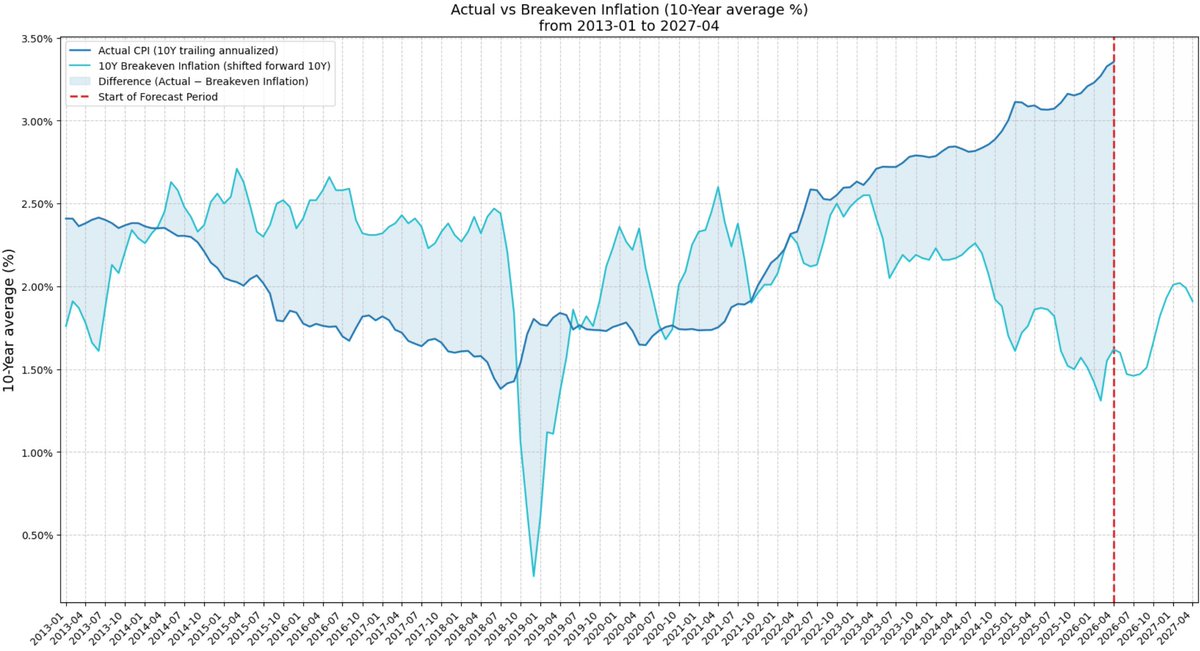
The article makes an interesting point about TIPS liquidity affecting breakeven accuracy.
I backtested the 10-Year Breakeven Inflation Rate by shifting it forward 10 years and comparing it to trailing 10-year annualized CPI inflation (calculated from actual price levels).
As the chart shows, breakeven inflation from a decade ago has been reasonably good most of the time, but it significantly underestimated the inflation that actually materialized over the past 10 years. The current gap is approximately 1.75 percentage points.
Full analysis and code here: https://t.co/tndKI3VzgG
Inflation-linked government bonds offer the ultimate protection against investors’ fears. So why aren’t more people turning to them? https://t.co/7nNXiV24ek
Americans now expect 4.8% CPI inflation over the next 12 months (Univ. of Michigan Survey). Latest CPI is running at ~3.8% YoY.
Here's how UMich expectations have tracked reality historically — often more accurate than Cleveland Fed's.
Full analysis: https://t.co/tndKI3W76e
#Inflation #CPI #Economics
With current YoY consumer price inflation at 3.8%, what is it expected to be a year from now? Per the latest Cleveland Fed data: 3.5%. Two years out, expectations improve to 2.4%. After mid-2027, inflation is projected to stabilize around 2.2-2.4%.
Expectations have worsened notably compared to a month ago. Markets increasingly doubt the Fed will bring inflation back to 2% over the next decade.
Full analysis: https://t.co/ptr4NQRMMr
#InflationExpectations #CPI
🇺🇸 Fresh US CPI data — April 2026:
Consumer price inflation accelerated to 3.8% YoY — significantly above the Fed’s 2% target.
The 3-month annualized rate (Feb–Apr) rose to 7.3%.
Full charts, data & code in the Jupyter notebook:
https://t.co/ptr4NQRMMr
#CPI #Inflation #Economy
🇺🇸 Fresh US CPI data — April 2026:
Consumer price inflation accelerated to 3.8% YoY — significantly above the Fed’s 2% target.
The 3-month annualized rate (Feb–Apr) rose to 7.3%.
Full charts, data & code in the Jupyter notebook:
https://t.co/ptr4NQRMMr
#CPI #Inflation #Economy