La proeza de Lula termina siendo parte del problema. La misma carta de Bolsonaro de hoy abre diciendo que sumar 10 millones de votos es "matemáticamente imposible".
Otra forma de ver el incremento de votos entre 1era y 2da ronda creo que es útil y más digerible 🧵
@mgaldino Ótima análise! Se virar artigo acadêmico mesmo, recomendo este método de inferência ecológica, que adota suposições mais plausíveis e oferece análise de sensibilidade. Usei o pacote R para analisar mudanças por grupo demográfico entre o 1º e o 2º turno.
https://t.co/Nvs1DdDRdm
@alt_ccc Of 498k ballot boxes in Brazil, 106 had zero votes for Flávio. 68 of them are in Indigenous villages and most of the rest are in remote rural or Amazon riverside communities. 4 ballot boxes had zero votes for Lula.
Where did Lula's extra votes come from?
Voters of the other candidates split almost evenly and gave him a net of 0.6 million.
The bulk came from people who had cast blank or spoiled ballots, or stayed home: a net 4.3 million.
(An estimate, station by station.)
@berjardim Farm share é a participação da agropecuária no PIB do município (IBGE). Sobre os evangélicos: os dados agregados não permitem identificar os motivos. Uma hipótese é que o noticiário negativo sobre Flávio (Ana Clara, denúncias, festa na lancha) corroeu parte do apoio desse grupo.
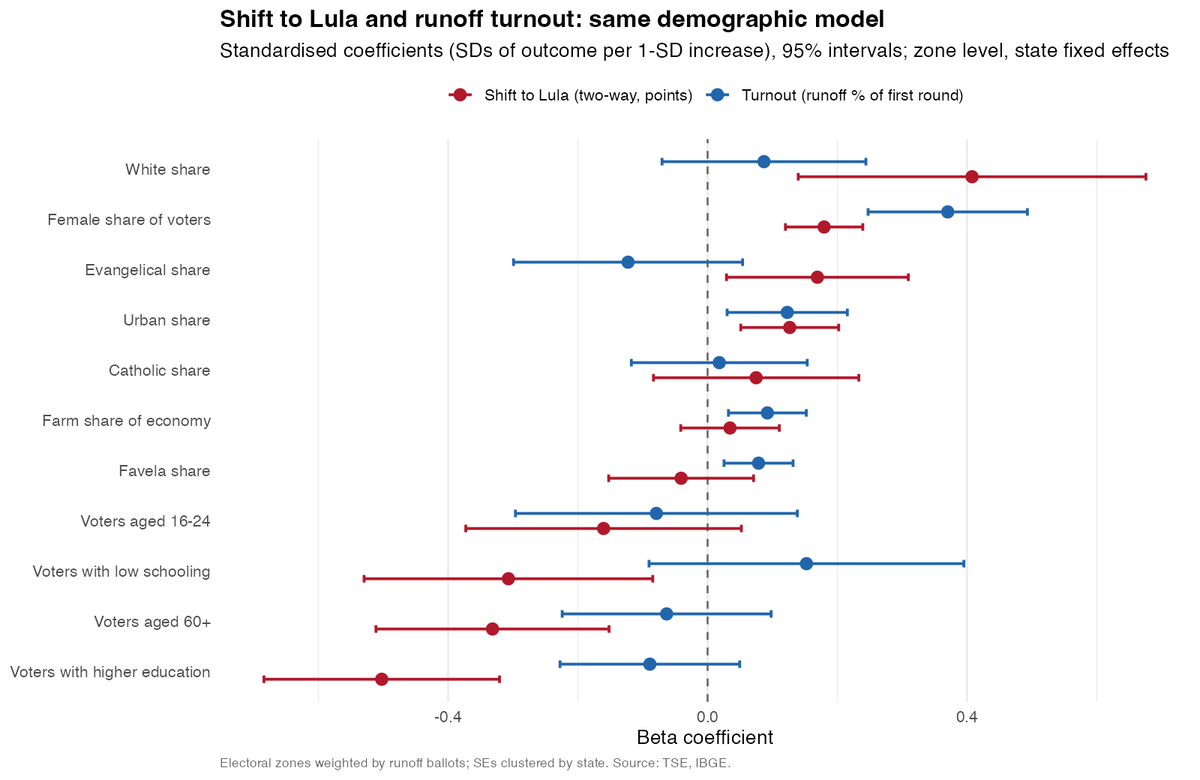
How did Lula win the runoff? By winning over those who didn’t vote for him in round 1. His biggest gains came in places with more women, more white voters and more evangelicals. 🧵
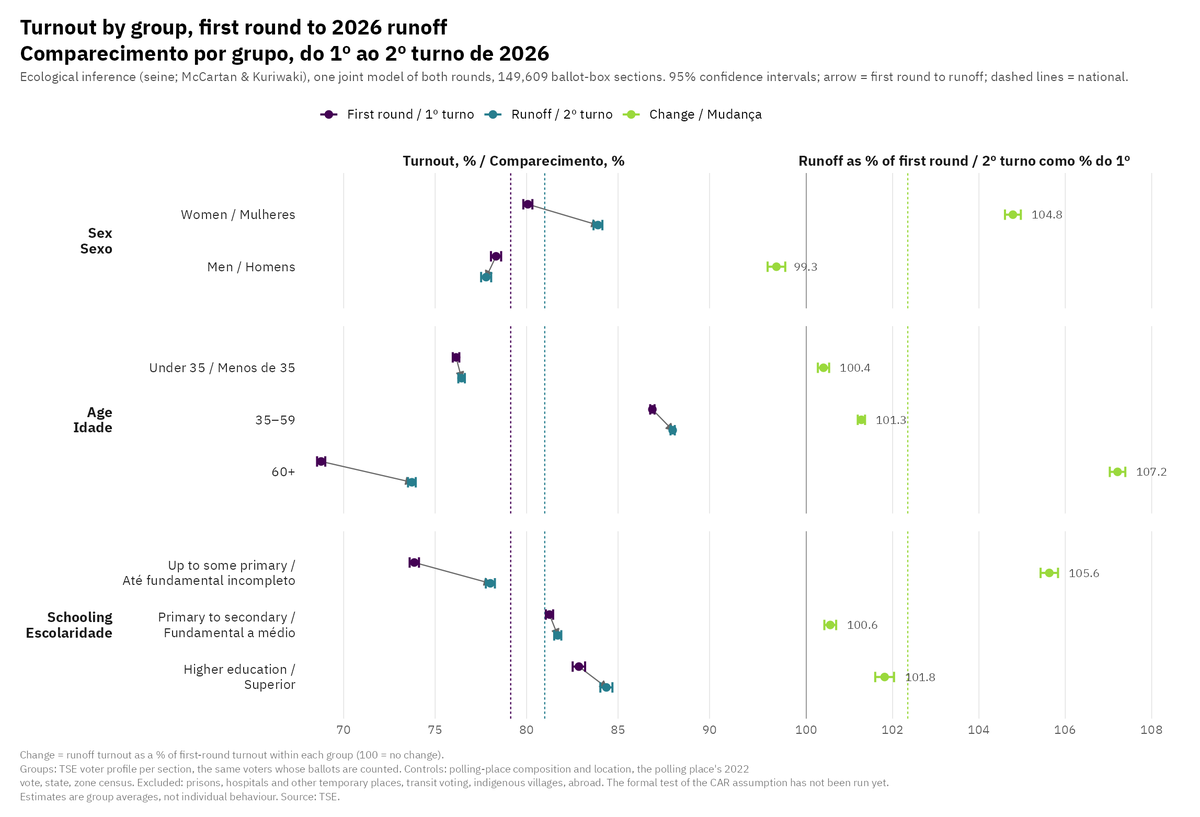
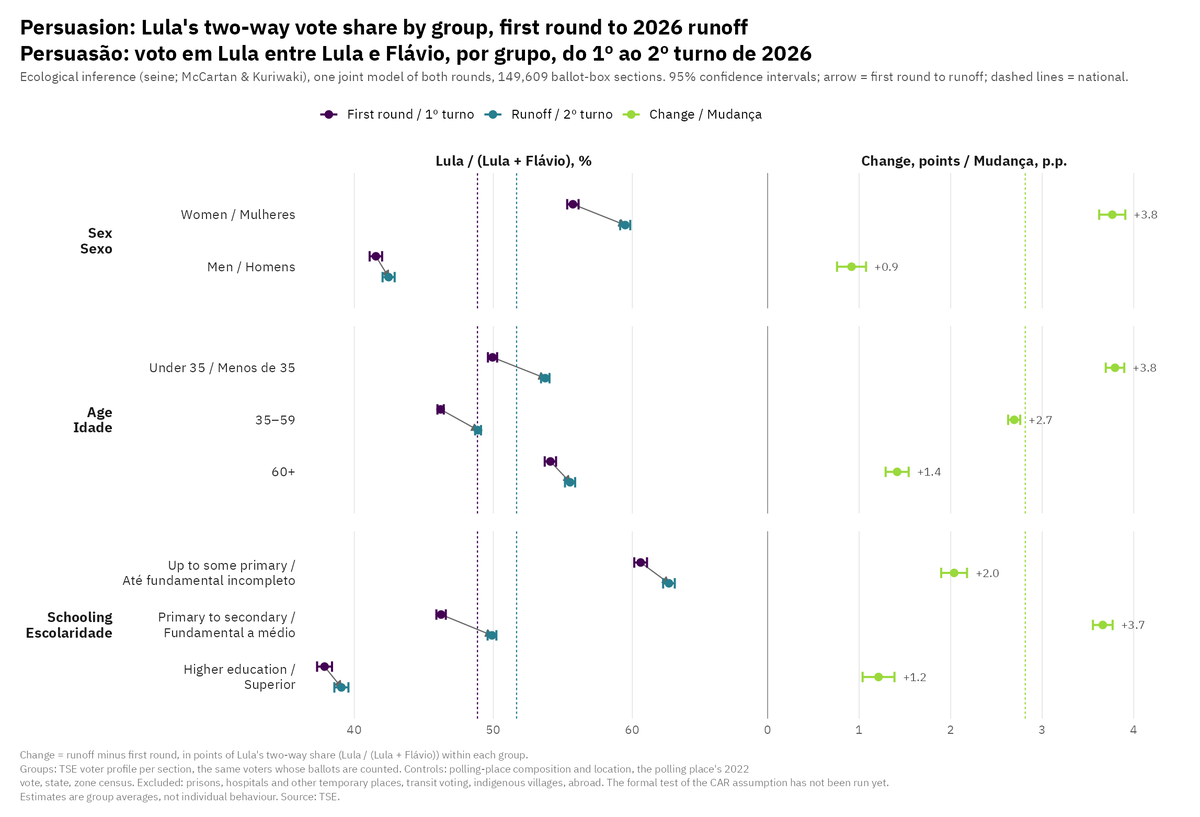
Method: ecological inference (the seine R package) on ~150k ballot-box sections, with one joint model for both rounds. Groups come from TSE’s voter profile for each section. Controls: the polling place’s composition, location and 2022 vote, plus state and census data.
How did Lula win the runoff? Part 2 🧵
Women shifted toward Lula and accounted for the net fall in abstention.
A closer look by sex, age and schooling, using @shirokuriwaki & @CoryMcCartan’s ecological-inference method for ballot boxes, the most detailed level available.
Those with at most some primary school are Lula’s base: 60.6% → 62.6% (+2.0), and their turnout rose 5.6%.
The real shift came from those with primary-to-secondary schooling: 46.2% → 49.9% (+3.7). College-educated: +1.2.
Women already leaned Lula in round 1 (55.7% of the two-way vote vs 41.6% for men) and moved further in the runoff: 59.5% (+3.8). Men: +0.9.
They also drove the entire drop in abstention: women’s turnout rose ~4 pts (80% → 84%); men’s barely changed (78.3% → 77.8%).
@guilhermejd1@rnishimura Concordo, Guilherme. A associação entre zonas, por si só, não identifica o voto individual nem estreita esses bounds. Mas ela informa sobre a geografia da mudança eleitoral. Persuasão é uma hipótese compatível com esse padrão, não uma conclusão que os dados permitam identificar.
@rnishimura Faz falta mesmo. Mas os resultados detalhados do TSE, cruzados com dados demográficos, permitem identificar padrões de como o voto mudou entre o 1º e o 2º turno. Não revelam quem mudou de voto nem por quê, mas dão algumas pistas. Explorei isso aqui👇 https://t.co/xxoLfv9Cz2
How did Lula win the runoff? By winning over those who didn’t vote for him in round 1. His biggest gains came in places with more women, more white voters and more evangelicals. 🧵
More evangelical zones swung further toward Lula, despite smaller increases in ballots cast in those areas. The swing remains positive after demographic controls.