13/05/2026.. I have updated my portfolio with some of my latest work😄. Check it out at https://t.co/PS8oUke85H.. I look forward to maintaining with regular updates .
#GIS#geospatial
Sometimes the #story starts with just circles on a #map.
What looks simple from above is actually a deeper story of land patterns and understanding how we can use #geospatial#AI to understand the stories.
#google#satellite#embeddings
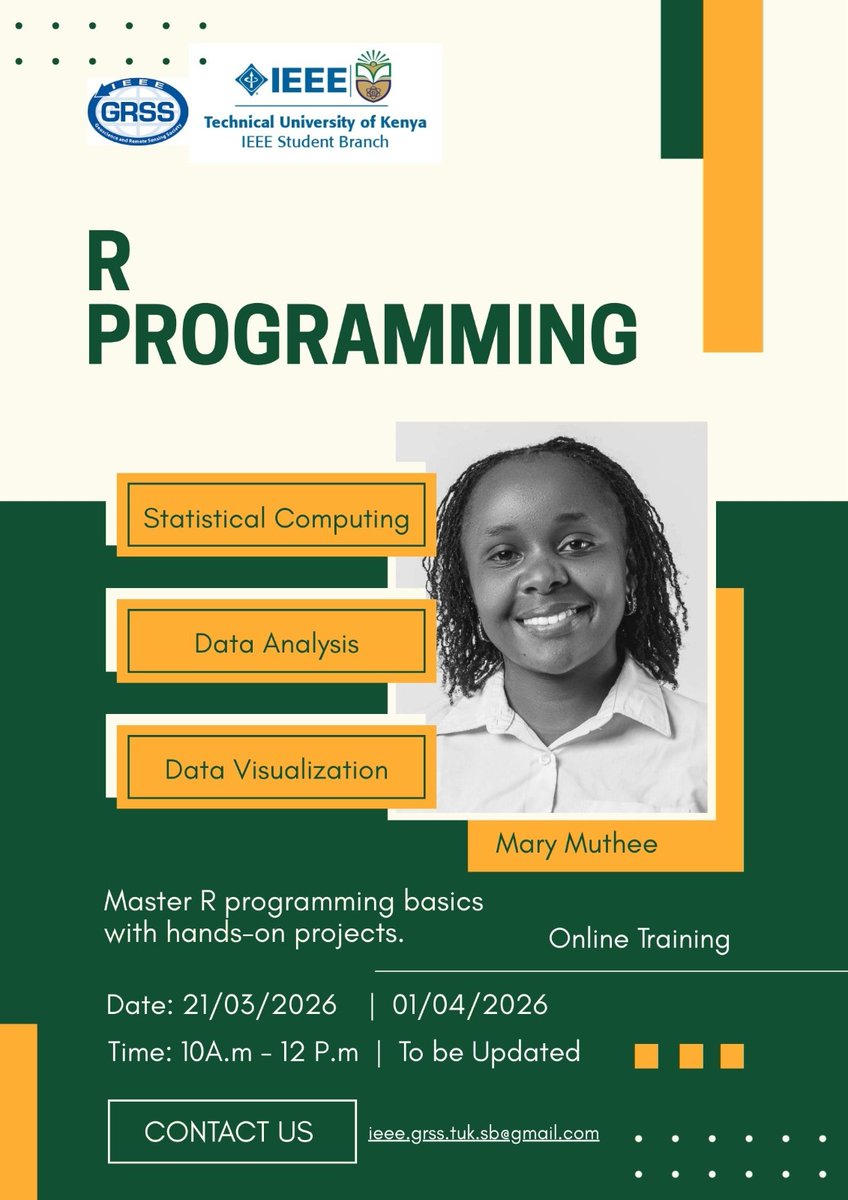
Join us on 21/03/2026 for a hands on-training on R ,The training will be beginners friendly.
Registration link- https://t.co/66kEVFWcpq
#geospatial#R#GIS#GeoAI
I'm doing an eye tracking analysis to help improve more on this infographic.
Anyone can take part in the test process.
link to the survey-https://t.co/RNmvxR7OzI
#gischat#geospatial#GISDAY
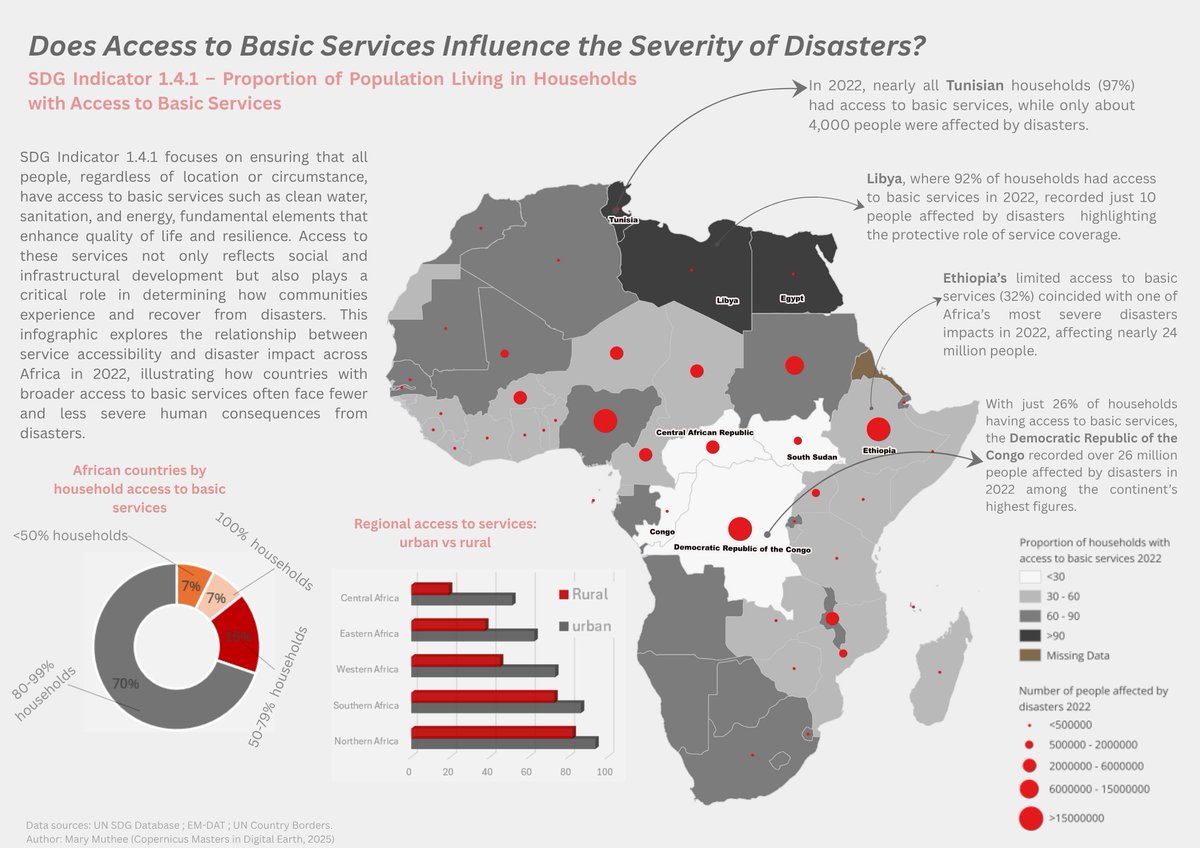
20/10/2025..As a way of using #cartography in storytelling, I explored #SDG 1 (Indicator 1.4.1) and linked it to #disasters.
Does access to #basic#services affect disaster severity?
I overlaid the two layers to visually inspect the relationship and to show how access to basic services is distributed across #Africa.
Tools used:
1.R – #Data preprocessing and cleaning
2.QGIS – #Map design and #spatial visualization
3.Excel – Chart creation and #statistical breakdowns
3.Canva – #Infographic layout and
#storytelling
#geospatial #gischat
Recently,a #landslide occured in #Elgeyo Marakwet #Kenya. Using using #Sentinel-2 L2A (#SWIR) data on the #Copernicus#browser, I created a timelapse comparing #imagery from 19 October (before) and 6 November 2025 (after) to visualize the impact.
This shows how #EO data can be used in disaster assesments.
#gischat #geospatial #EO
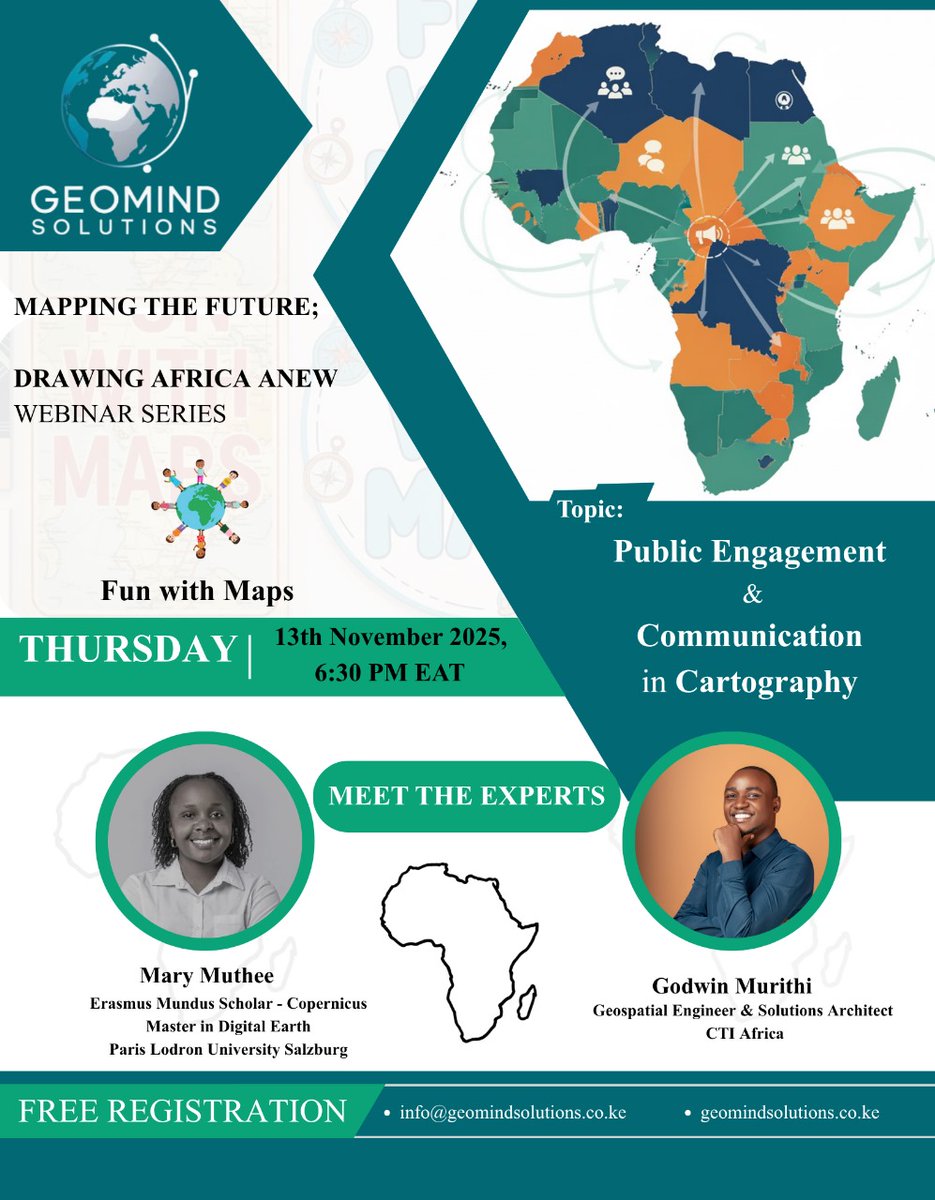
On 13th November 2025,I will be joining GeoMind solutions webinar as a #speaker for the "Mapping the Future: Drawing Africa a New Webinar Series"
We will be discussing on public engagement and communication in #Cartography, a key part of how to tell #Africa's stories through #maps
#geospatial #gischat
Registration link- https://t.co/mSBDpXU4Ki
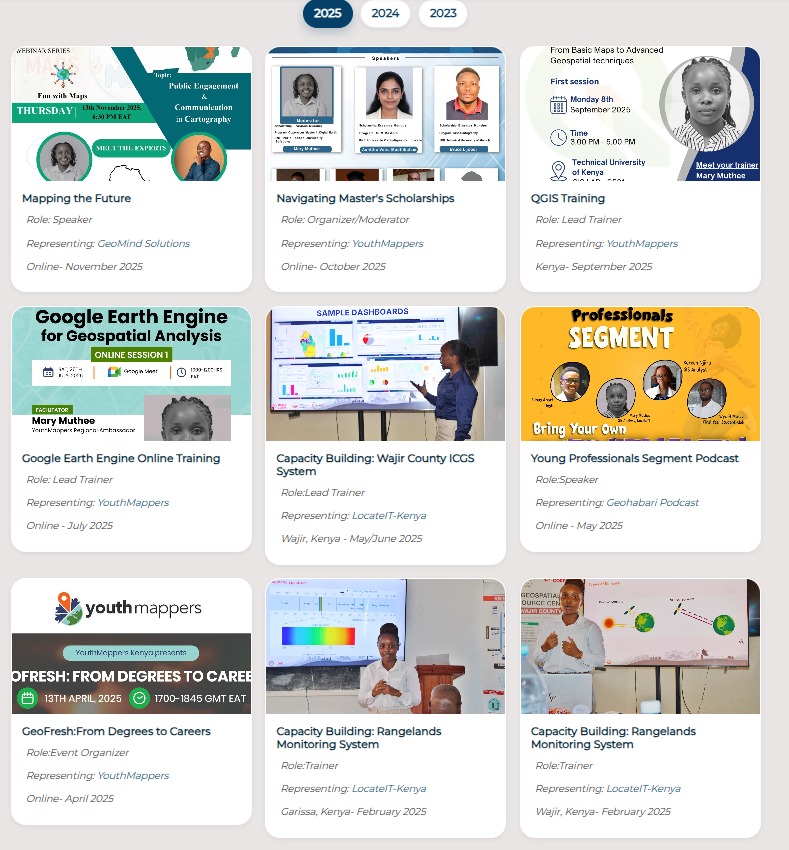
18/08/2025 . I’ve updated my portfolio with new #projects plus a #ProfessionalEngagements section (my favourite section) showcasing trainings, mentorships and events I've been involved in the #geospatial space.
Check out the new updates here- https://t.co/PS8oUke85H
20/10/2025..As a way of using #cartography in storytelling, I explored #SDG 1 (Indicator 1.4.1) and linked it to #disasters.
Does access to #basic#services affect disaster severity?
I overlaid the two layers to visually inspect the relationship and to show how access to basic services is distributed across #Africa.
Tools used:
1.R – #Data preprocessing and cleaning
2.QGIS – #Map design and #spatial visualization
3.Excel – Chart creation and #statistical breakdowns
3.Canva – #Infographic layout and
#storytelling
#geospatial #gischat
I mapped this dataset using #QGIS with data from the #UN SDG 5.5.1 indicator on women’s representation in national parliaments (2020).
It’s striking how #geography reflects progress some regions showing strong inclusion, others still catching up.
As a #geospatial specialist, I find it powerful how #maps can turn statistics into stories helping visualize equality, or its absence, at a glance.