@LivpureSmart
I’m very disappointed with your service. It’s been over 2 months since I raised a cancellation request (Ticket No: 4761498463829) for my rented RO, still no pickup, no refund, no response. Please resolve this immediately and refund my initial amount. #Livpure
@OneCardHelp@GetOneCardIN
The metal card's backside plastic sticker is coming off, not a very premium experience. Should I be paying 3000 rupees to get the same metal card?
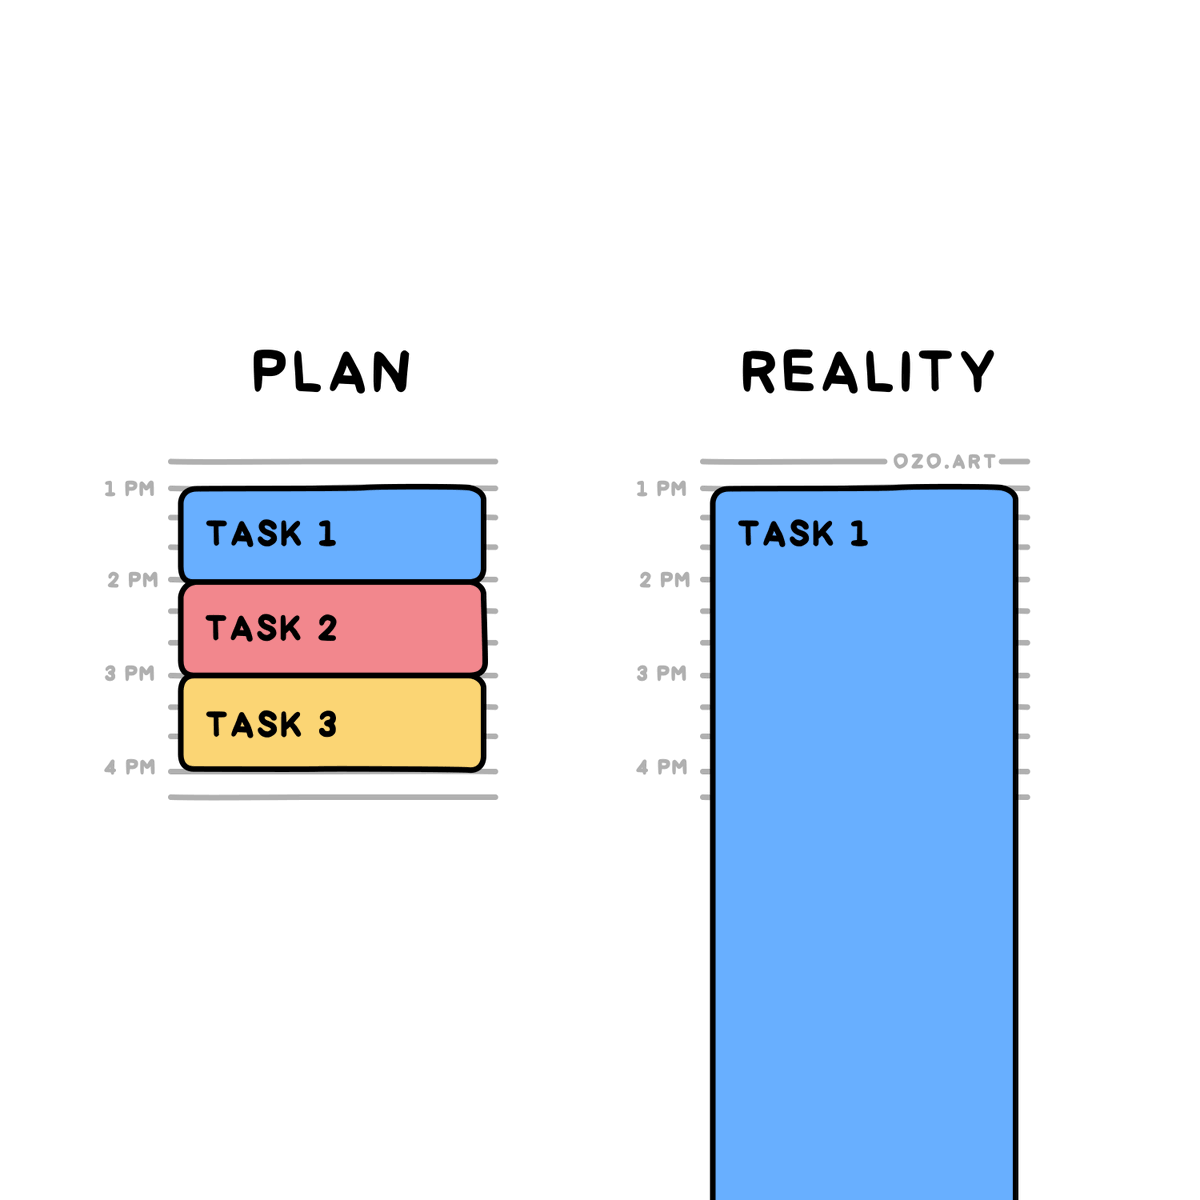
Dear managers: Raising productivity is not about monitoring people. It's about motivating them.
94 studies: Surveillance fails to improve performance—and increases stress, distrust, and dissatisfaction.
Tracking people is not a substitute for respecting and valuing them.
Crowdstrike Analysis:
It was a NULL pointer from the memory unsafe C++ language.
Since I am a professional C++ programmer, let me decode this stack trace dump for you.
@LivpureSmrtHome@LivpureSmart, if you are unable to fulfill your service obligations, I kindly request the cancellation of my subscription and a full refund of both the subscription fees and security deposit.
Logging, tracing and metrics are 3 pillars of system observability.
The diagram below shows their definitions and typical architectures.
🔹 Logging
Logging records discrete events in the system. For example, we can record an incoming request or a visit to databases as events. It has the highest volume. ELK (Elastic-Logstash-Kibana) stack is often used to build a log analysis platform. We often define a standardized logging format for different teams to implement, so that we can leverage keywords when searching among massive amounts of logs.
🔹 Tracing
Tracing is usually request-scoped. For example, a user request goes through the API gateway, load balancer, service A, service B, and database, which can be visualized in the tracing systems. This is useful when we are trying to identify the bottlenecks in the system. We use OpenTelemetry to showcase the typical architecture, which unifies the 3 pillars in a single framework.
🔹 Metrics
Metrics are usually aggregatable information from the system. For example, service QPS, API responsiveness, service latency, etc. The raw data is recorded in time-series databases like InfluxDB. Prometheus pulls the data and transforms the data based on pre-defined alerting rules. Then the data is sent to Grafana for display or to the alert manager which then sends out email, SMS, or Slack notifications or alerts.
Over to you: Which tools have you used for system monitoring?
--
Subscribe to our weekly newsletter to get a Free System Design PDF (158 pages): https://t.co/FIzCeaWsZV
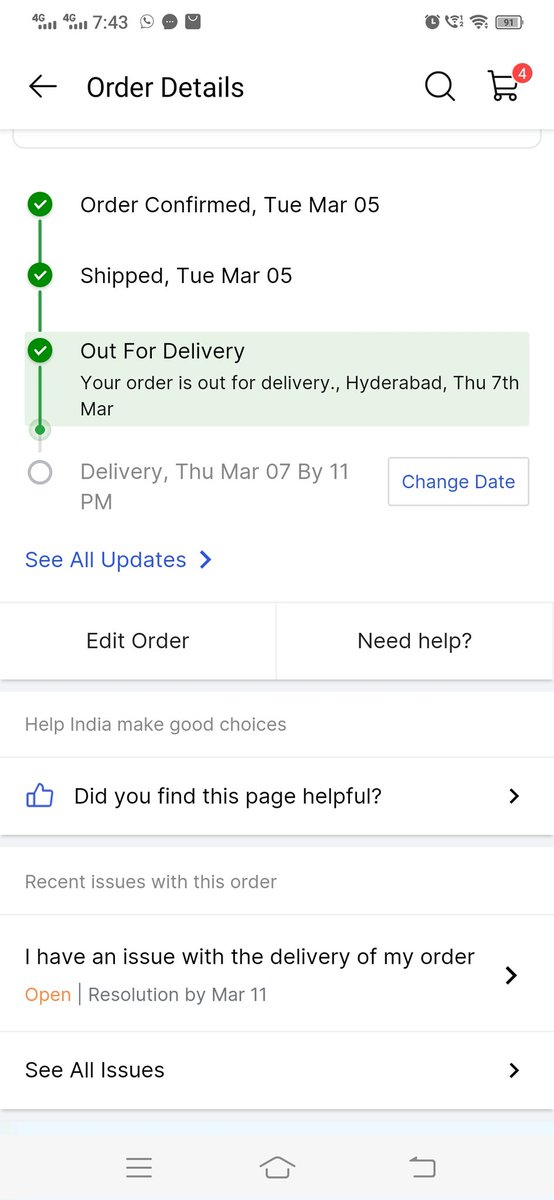
@flipkartsupport@flipkartsupport@Flipkart I personally went to the nearest Flipkart warehouse and confirmed my order was there. However, the staff alleged false delivery attempts and cited staffing shortages as the reason for not handing over the order.
@flipkartsupport Utterly fed up with @Flipkart's inability to deliver on time! It's not just an inconvenience anymore; it's a complete letdown. Each delayed delivery adds to the mounting frustration. Flipkart, you're failing your customers. Incident ID: IN24030722073480198503