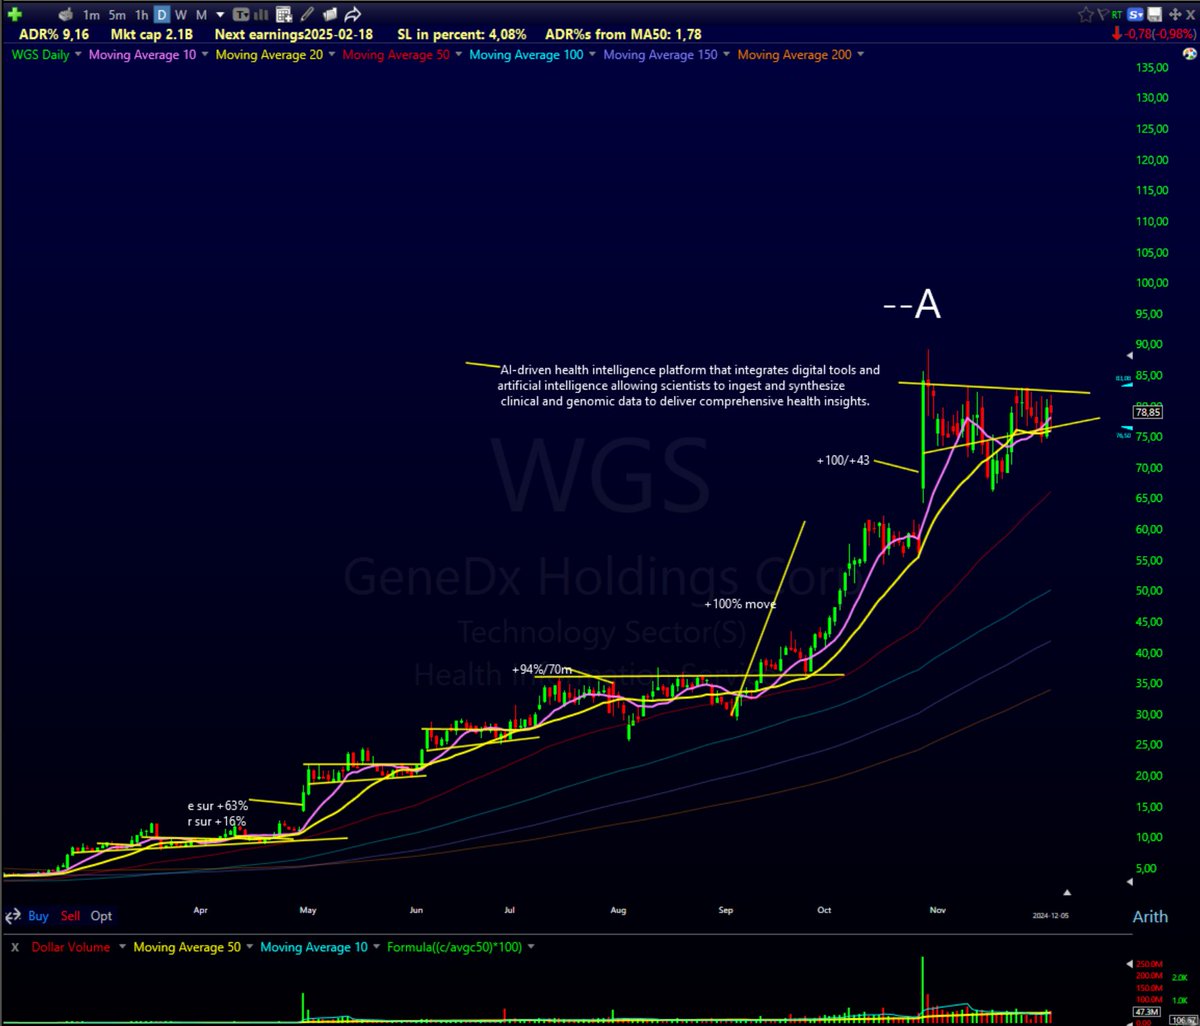
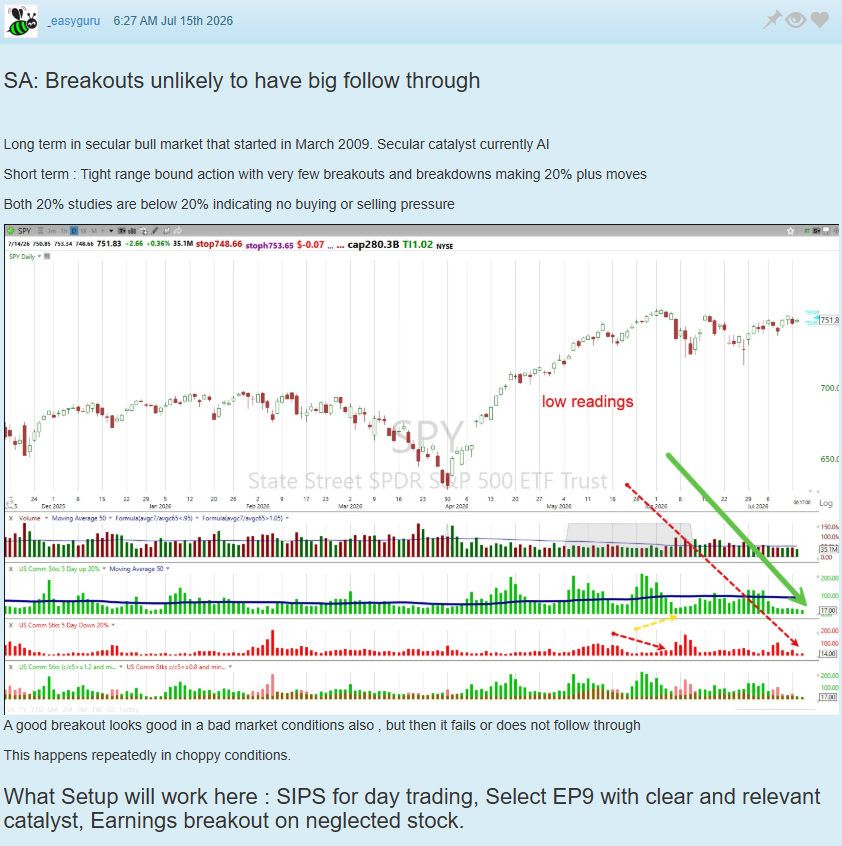
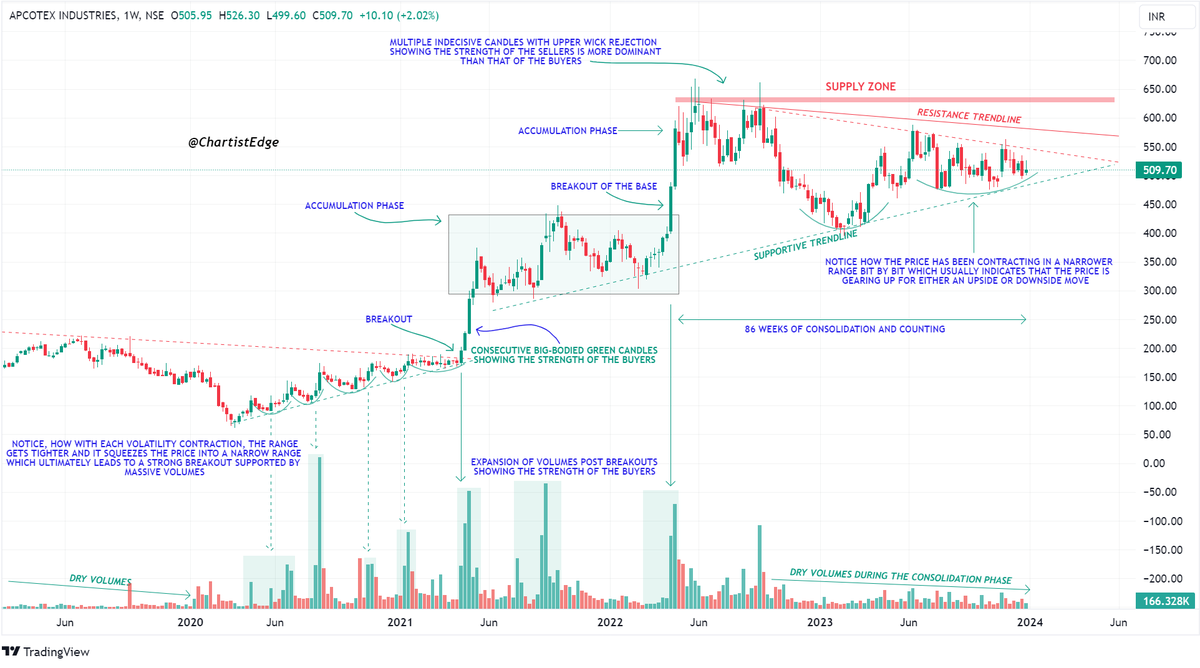
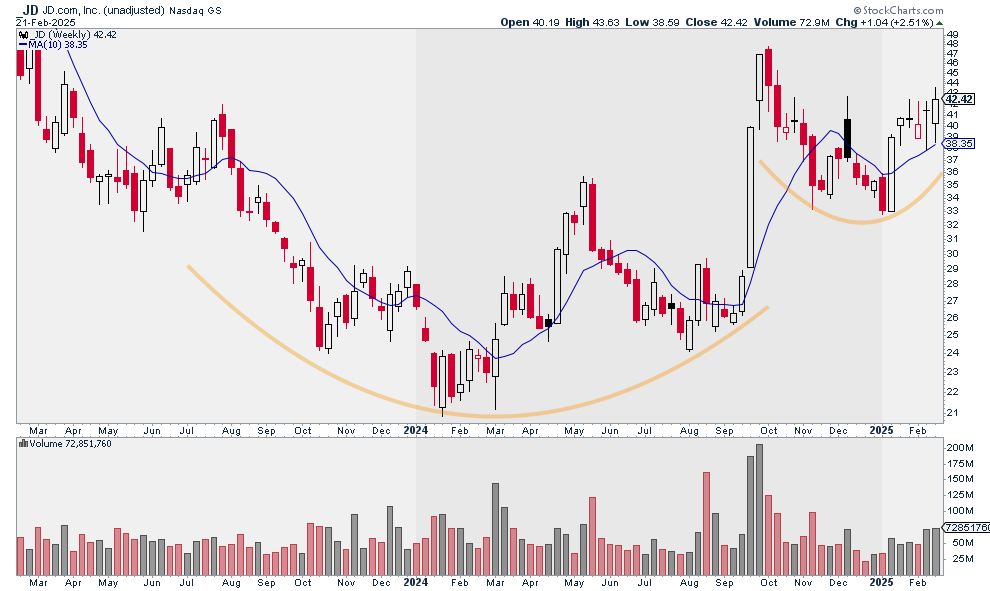
I see a few questions about scanning process for finding delayed EP setups . It's much simpler than most people think.
In this video, I'll show you the exact process I use and how I build a database of delayed EP names for future opportunities.
Watch the video and let me know what you think. If you have any questions, drop them in the comments and I'll do my best to answer them.
Good luck
Here is how I train my mind to spot out potential leaders in the market⏬
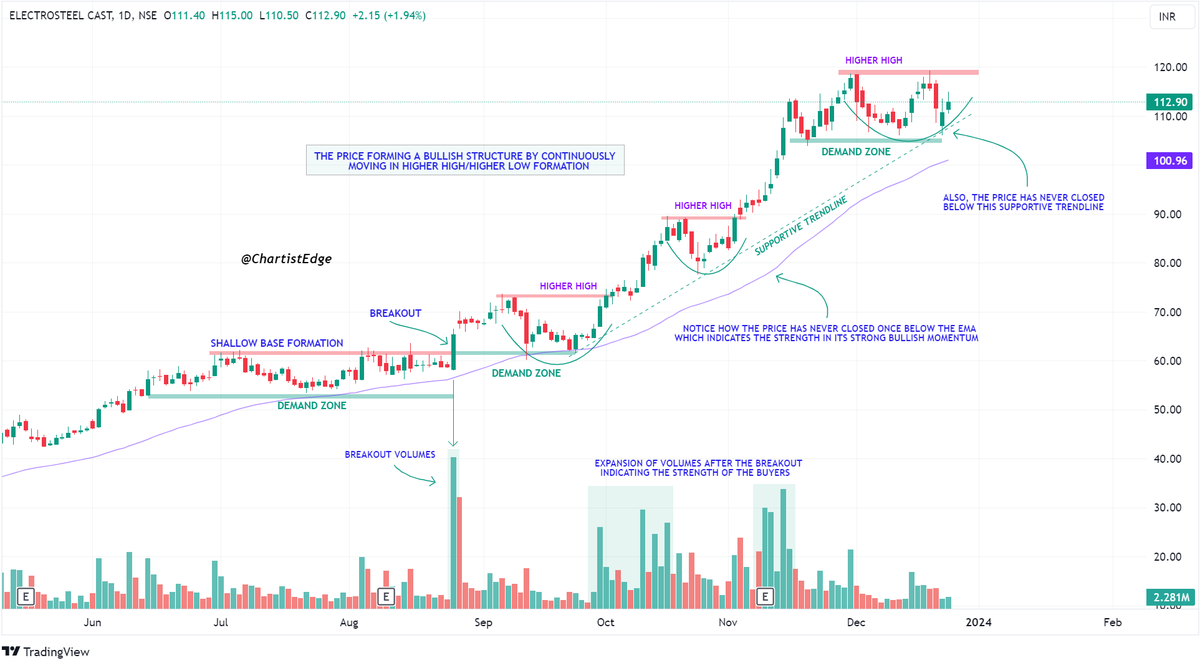
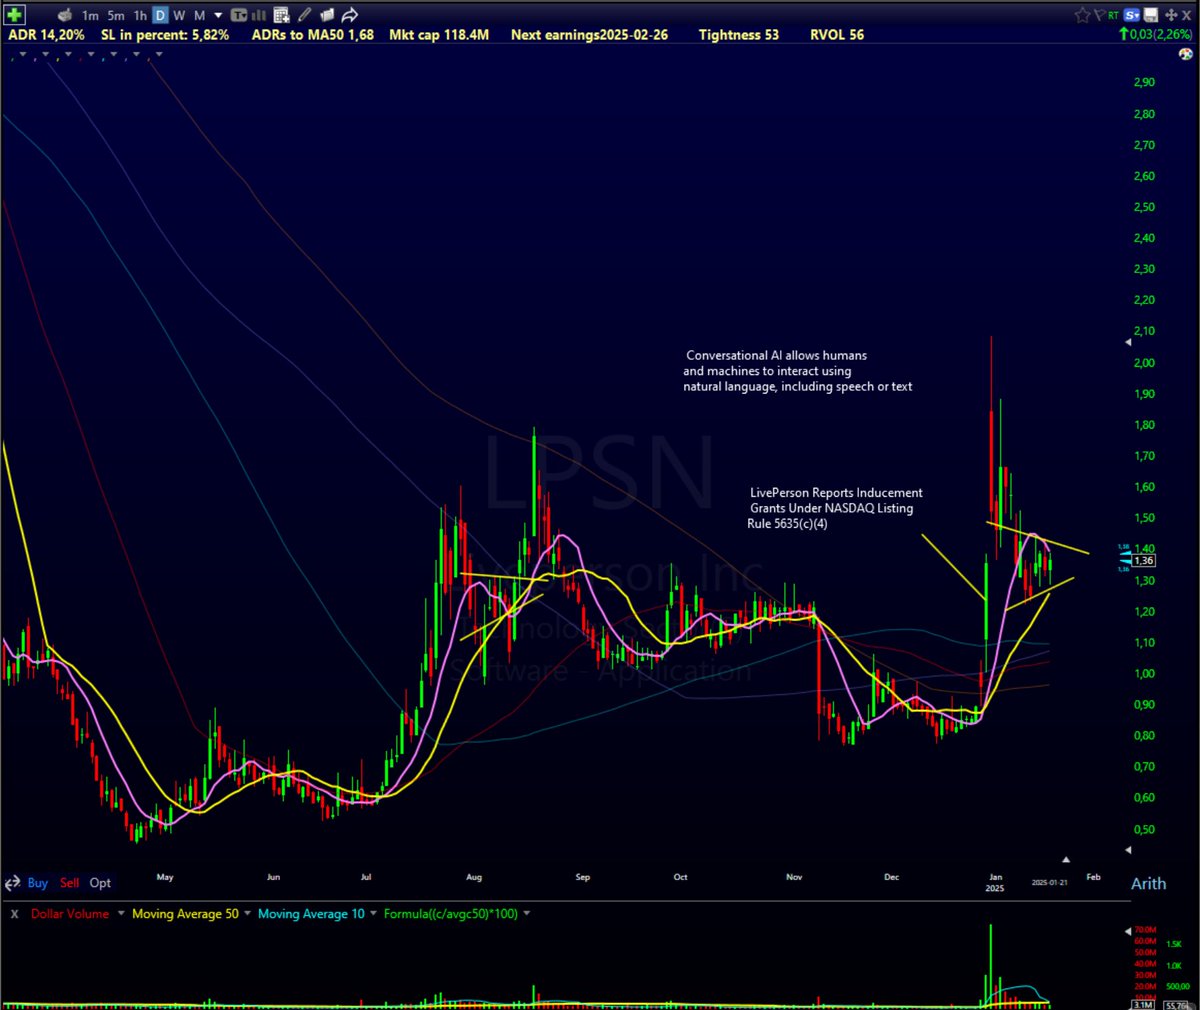
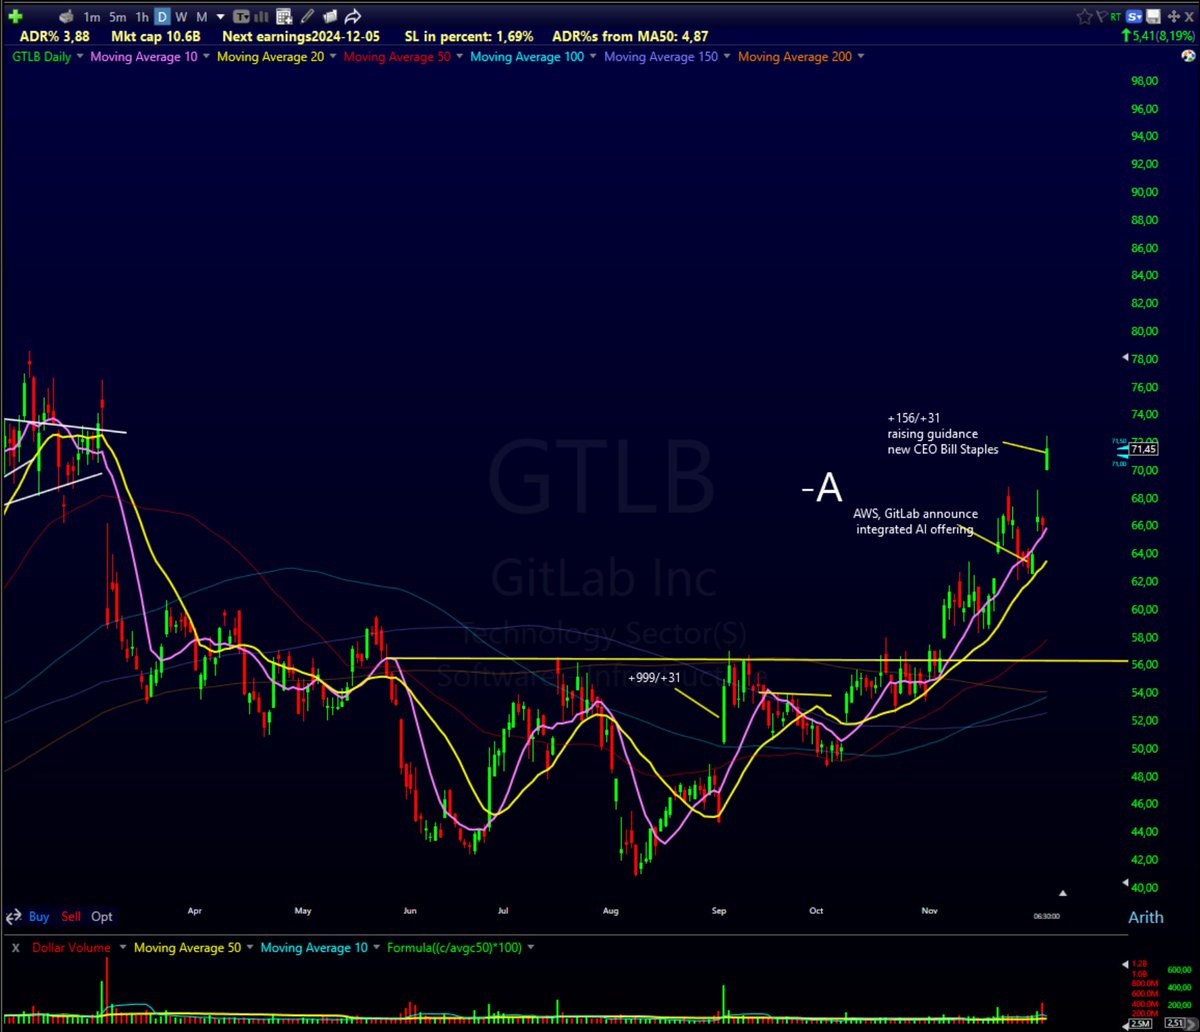
I pen down everything that I see on a chart. It helps me spot the key triggers that pushes the price higher.
This activity helps your mind develop a core memory of what to focus on and what to ignore while scanning.
Do this activity again and again and you will start to notice huge improvements in your chart reading skills.
Some examples of how I do it⏬
6 Entry Types Every Swing Trader Should Know
1. PDH Entry
Price moves above the Previous Day’s High. It shows strength continuing from the last session.
2. Strong Start Entry
A stock opens well and shows clear strength and high volumes in the first few minutes. After the initial push, a break of any range formation could be used as an entry . Useful in leading stocks.
3. Pivot Break Entry
Price breaks a level that has been rejected multiple times. This suggests sellers at that level are finally out of the way. A clean breakout candle usually confirms it.
4. Anticipation Entry
Entering slightly before a breakout, usually inside a tight consolidation on a day where price has gone pretty tight, at EOD. The structure should already be strong so the breakout has a higher chance of happening. Gives better risk–reward.
Q showing a 7 star setup on a 5 star scale.
"this is like a big big move, goes sideways. builds a tight range, and look at how tight it gets look at this thing, it breaks out and boom. this is like a seven star setup on a five star scale. memorize this this is the basic principle we're trying to like stocks move like stairs. right, you get a leg higher, sideways, leg higher, sideways you get another step higher, sideways, step higher sideways, so we are trying to identify the areas when the next step higher could be formed. you know tight areas we're looking for tight areas so we can get a tight stop so we can get a good risk reward.
This is how stocks move. like this one is kind of a perfect one most are not perfect but this is the basic principle this is how stocks have moved in 100 years and there is no reason they should stop moving like this just because you're getting started in trading..."
This is David Ryan.
He turned $20k into $900k in just 3 years. How?
He mastered the art of identifying big winners, timing trades, and scaling aggressively.
Here are 8 advanced lessons from his incredible journey 🧵👇
If you like Such Learning Posts
( 1 ) Please Follow me on X
@ankurpatel59
My YouTube Videos will also help you to Up Your Trading Game.
( 2 )Subscribe Here - https://t.co/aJJkKqtVWm
Bookmark and Retweet this Post
How do I intraday determine how strong or weak the underlying market is?
I use five tools for this:
1) Feedback from my own list of positions (because they should be the TMLs of the market)
2) Market monitor (how many stock are up or down 5% on the day and how many industries are up vs down for the day)
3) Breadth indicators layout
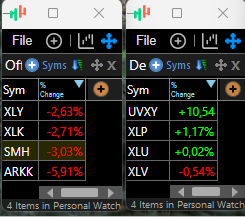
4) Defence/Offence ETF lists
5) Trend day layout
More info on Trend day concept:
https://t.co/UvEx0tRbQW
A few stocks that have huge potential in the long-run:
$RKLB
$IONQ
$NBIS
$ALAB
$ACHR
$TEM
$HOOD
All are starting to enter a great risk / reward area for commons.
If you missed them the first time around, now could be your chance.
🎯
My @Deepvue thematic tracker after this weekend and yesterday's screening/
1. Robotics.
2. Space
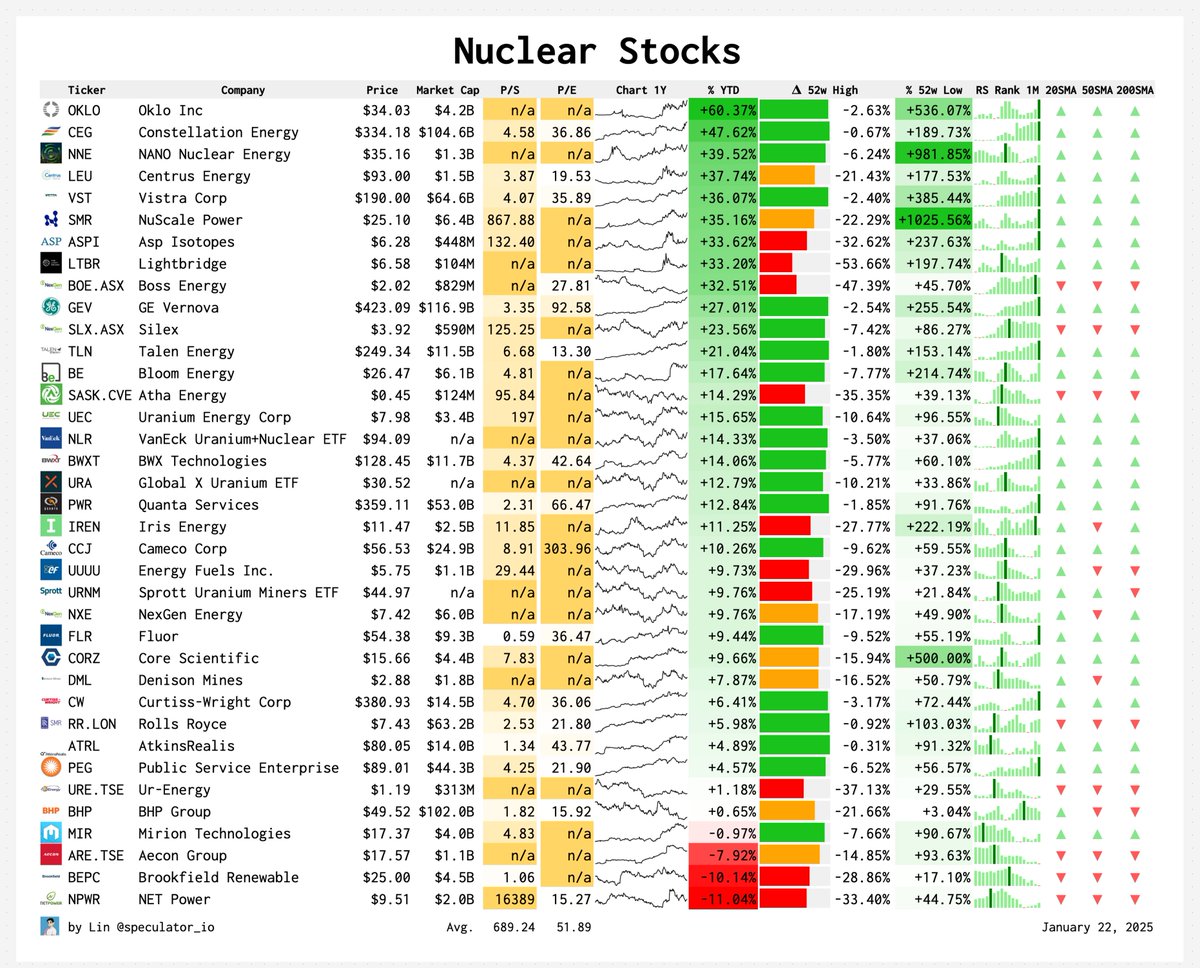
3. Power generation
4. AI/Data Center
5. Cybersecurity
6. EV/Battery
Other: Crypto
One of the hardest lessons you can learn as a trader is how quickly gains can evaporate when the market goes into a correction.
Without a system to protect these gains, one bad week can literally wipe away months of progress.
Instead, implement Total Portfolio Drawdown Rules:
—
Let's start by covering Circuit Breakers, and how these form the foundation for Total Portfolio Drawdown Rules:
You apply Circuit Breakers as a means to stop yourself from yourself. These pre-defined rules go into action when your portfolio draws down certain percentages off the highs.
Large Money Managers
→ 5% off highs: Cut position sizes in half & sell the weakest holdings
→ 10% off highs: Stop new buys, raise stops, manage current exposure tightly
→ 15% off highs: Move fully to cash to protect remaining profit
Smaller accounts/newer traders
→ 3% off highs: Cut position sizes in half & sell the weakest holdings
→ 5% off highs: Stop new buys, raise stops, manage current exposure tightly
→ 10% off highs: Move fully to cash to protect remaining profit
—
Some of the best portfolio managers we know trade exactly like this — they listen to their Equity Curve more than anything.
They're not interested in giving back large amounts of progress because of "what they think". They listen to the market, scale back when the environment is negative, and then scale up when it's back in favor.
—
If you've given back months of progress in 10-15 days, you don't have an approach to stop yourself from yourself.
The rules above help you avoid taking the elevator down when you took the stair case up.
🦁
Setups for today...
HTF $CVAC $LAES $LPSN $MVST $OPTT $RR
VCP $APP $NNOX $VCP $SEI
EP Late Entry $APLD $CAN $GH $TEM $VSAT
Themes I keep an eye on: Space, AI, Datacenters, Crypto, AI Power, Drones AAV, Cancer, Quantum, Robotics...
What stocks are you looking to trade today?
Attention High Tight Flag traders! $IONQ is setting up what you could argue is it's second HTF in a row. If you buy too early you can get sold to easily. Waiting for that perfect spot: