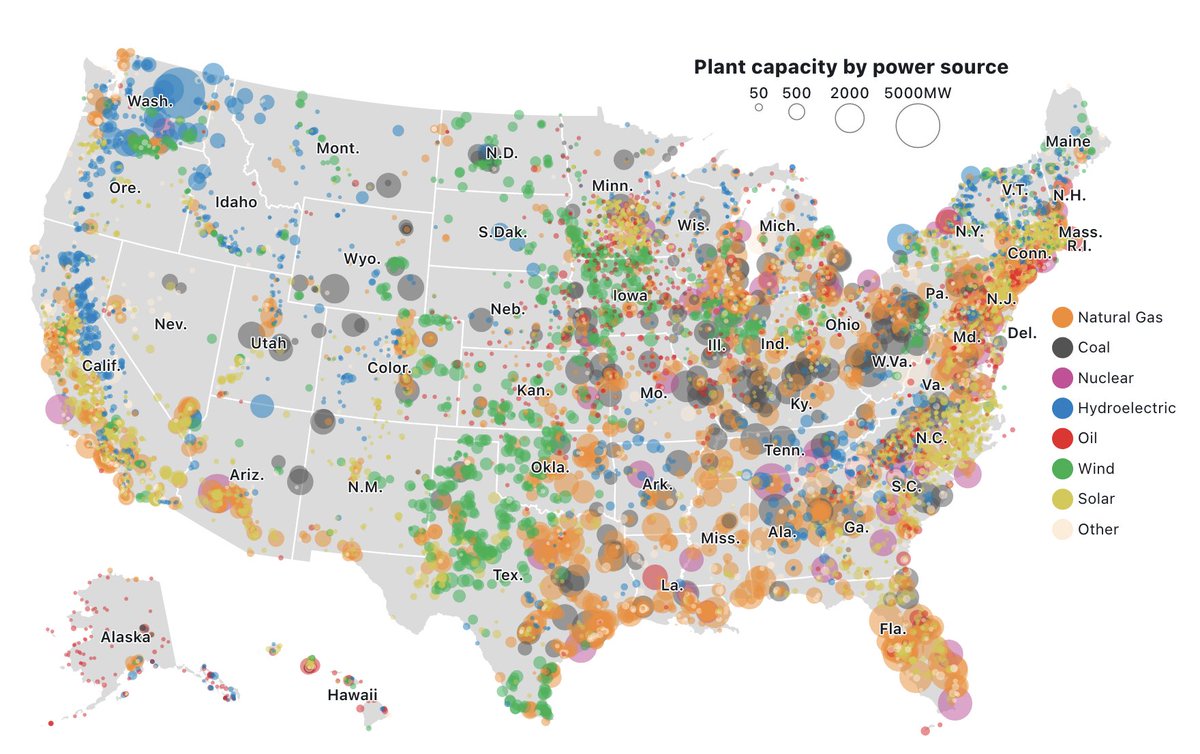
Recreating existing visualizations is a fun way to learn new skills - feels like solving a puzzle 🧩. As an exercise, @recifs & I recently recreated a map of US power plants from the Washington Post in @observablehq Plot 🗺️ https://t.co/76d9H3Zhei
Californian Snowflakes - monochrome #map of record snowfall (to date) using real snowflakes. Hi-res, how-to, and reusable Wilson Bentley snowflake styles on the way.
No rainbows were harmed making this map. Feel free to comment, and critique.
#Snowfall#CaliforniaSnow
I have a grid of entire world with some attributes, it is a 3gb of data and I want to optimize it to improve the speed of getting results, after query on single part of this grid. What can I do? #GIS#gischat#gischatbot@gischatbot https://t.co/ZDDxGkVleQ
#pgRouting Given a list of cities and the distances between each pair of cities, which is the shortest possible route that visits each city exactly once and returns to the origin city? #postgres#gischat
Did you know that the first GIS was developed by a Canadian named Roger Tomlinson? Tomlinson was a geographer who created the Canada Geographic Information System in the 1960s, which is considered to be the first GIS. #gischat
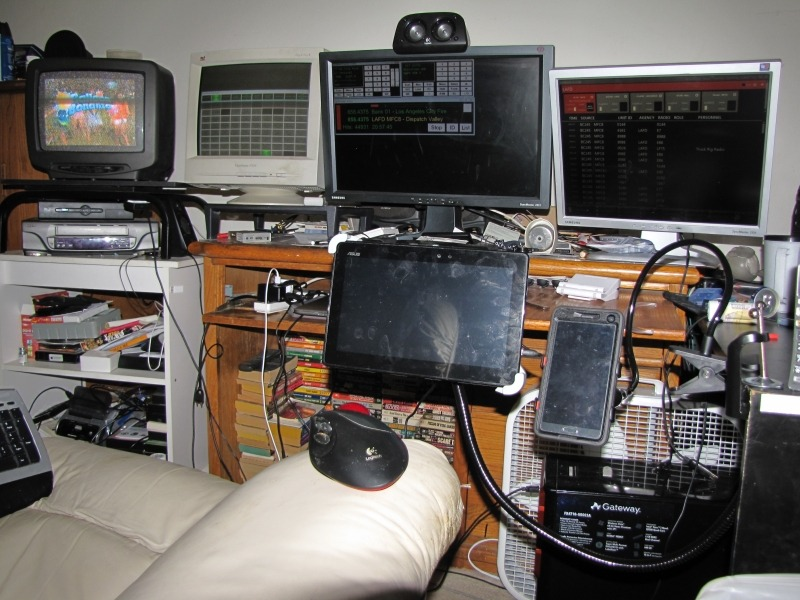
@Kevin_B_Haynes @graharg@gischatbot Three monitors is a necessity for GIS! A USB video card is perfect for adding that extra screen for around 20-30 dollars. Here's a slightly older photo (I've upgraded the tv) that shows my desk setup, with the additional tablet on an extension arm for tutorials/notes.