A lot of beginner traders have asked how to grow their account to $100K.
This is EXACTLY the lessons and resources you need:
1. Day trading course (free): https://t.co/vekfxlpF8y
2. Swing trading course (free): https://t.co/tT29B1pohy
3. All my buy and sell signals are here on X - you can sub for my exact entries and trades.
4. Finding trade setups: https://t.co/fWdJLNfQCO
I promise to guide you and teach you everything I can to get you to $100K and beyond. 💪
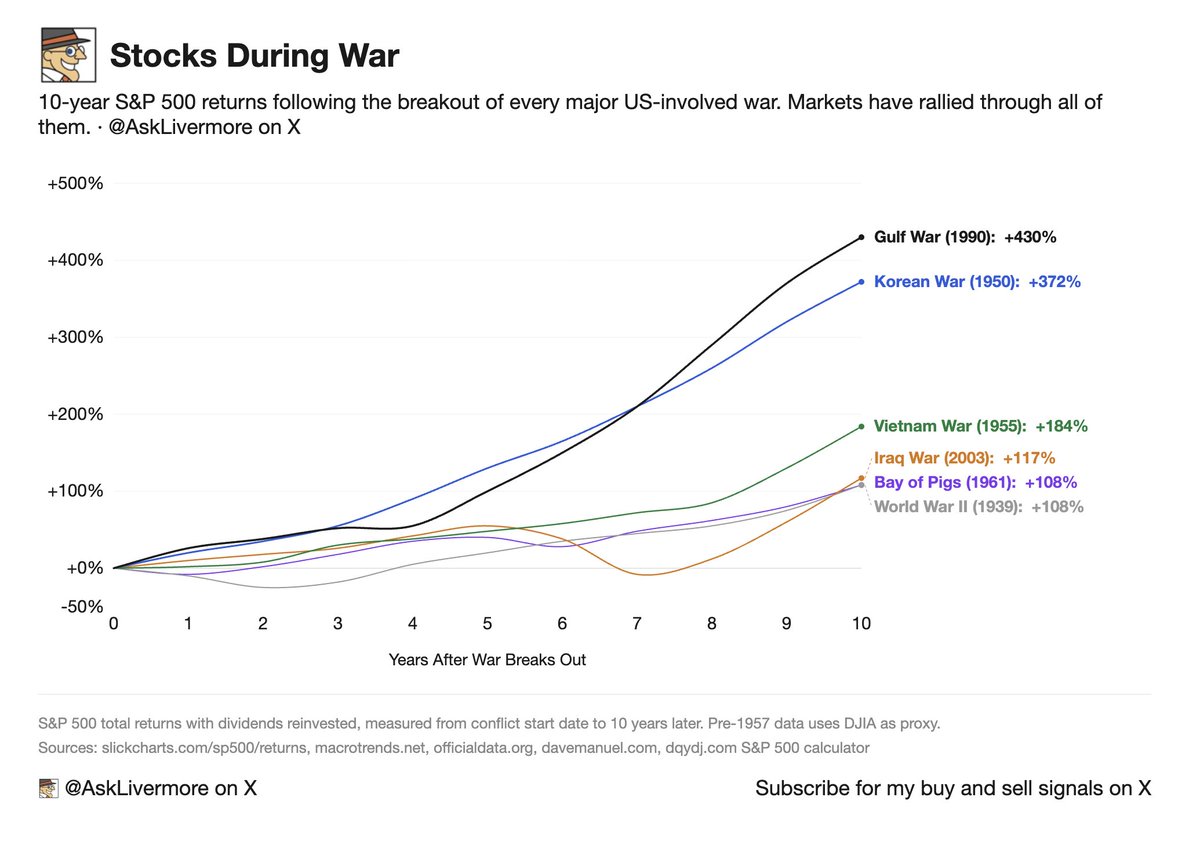
Iran-US war is creating fear. Fear creates sellers. And sellers create the best buying opportunities in history.
$SPY returns 10 years after a war broke out:
• Gulf War (1990): +430%
• Korean War (1950): +372%
• Vietnam War (1955): +184%
• Iraq War (2003): +117%
• Bay of Pigs (1961): +108%
• World War II (1939): +108%
The people who sold during these wars never got back in at lower prices. They got back in higher, or never got back in at all.
Always buy the fear.
$XLK, which is the technology sector ETF, has a chance.
Sellers are getting exhausted, bears are hesitant to short here. They will try to short the relief rally, but selling/shorting here is not in their best interest.
Are we in a bubble?
People are scared of 4 things right now: war, oil, rate hikes, and Japan.
Every single one of them was much worse in past selloffs:
1. War
• 2022 had Russia invading Ukraine.
• Oil hit $133.
• Bonds had their worst year in history.
• Today? Oil is $85. Bonds barely down.
2. Rate hikes
• In 2022 the Fed raised rates at the fastest pace in history.
• In 2018 the Fed spooked markets so bad Nasdaq dropped 24% in 3 months.
• Today? No hikes. Fed is on hold.
3. Japan
• In 2022 the yen crashed 30% and the market survived.
• Today the risk exists but is smaller than what already happened.
The real difference
• In every past crash, tech companies had no earnings.
• Today the biggest tech companies earn $450B+ a year in real profit.
The scoreboard:
1. Dot-Com: -78%
2. GFC: -56%
3. 2022: -33%
4. 2018: -24%
5. Now: -8%
Markets are pricing in fear right now, but things were much worse in the past.
$MU and $SNDK
Still no confirmation of a low yet, but it's getting choppier here - which is a good sign that shorts and bears are hesitant.
MACD histogram is also starting to show signs of seller exhaustion.
There could be a few more marginal lows to really put better bullish divergences, but these are the levels that are getting interesting.
There is hope in the future.
The Nasdaq 100 in 2026 is tracking almost identically to 4 previous years. Here's what was happening in each one and why the pattern rhymes:
1. 2003 (+42.8%). The Iraq War started in March. Oil spiked on geopolitical fear. Tech was hated after the dot com crash with stocks down 80%+. The Nasdaq dropped 7% early in the year on war uncertainty, then rallied relentlessly once the "known unknown" cleared. Sound familiar? Iran/Hormuz is 2026's geopolitical fear premium. AI/semi stocks are down 20 to 50%. The Fed was holding rates at 1.25%, just like the Fed is holding now at 3.50%.
2. 1996 (+40.2%). Election year. The Fed had hiked aggressively in 94 to 95, then paused at 5.25% and held. Tech had a sharp 10 to 15% correction in July on valuation concerns despite strong fundamentals. Then once election clarity arrived, the H2 rally was violent. 32% from the July lows to year end. 2026 is a midterm year with the same "uncertainty then clarity" setup.
3. 2013 (+30.8%). The taper tantrum. Bernanke signaled tapering QE in May, the 10Y yield spiked from 1.6% to 3.0%, everything sold off. But the economy was solid. The pullback was shallow, only 6%, because there was no actual recession. Once the market digested the new rate regime, it rallied 15%+ from the June lows. 2026's tech selloff feels the same. Policy fear creating rotation, but the underlying economy hasn't cracked.
4. 2007 (+18.5%). This is the cautionary analog. Oil surging from $50 to $75 on Middle East tension. Credit cracks surfacing. S&P making new highs while internals deteriorated. The mid-year pattern matches 2026 almost perfectly. But 2007 eventually broke down in 2008. The question for 2026 is whether the AI rotation is a digestive pullback like 2003 and 2013, or early warning like 2007.
The common thread:
• every one of these years sold off mid-year on a specific fear. War, oil, policy shift, credit.
• In 3 out of 4 cases, the fear was manageable and the market rallied hard in H2.
Going back to 1986, here's what August through December looks like in every midterm year:
• August: choppy, either a really bad month or a really good month. +4.2% median gain, but -1.0% average gain.
• September: bad month.
• October: +4.8% median, 80% win rate. This is the midterm rally.
• November: +4.5% median, 70% win rate. The rally continues.
• December: worst month typically with only a 40% win rate. Tax loss selling hits hard.
The total Aug to Dec return is +7.9% median with a 60% win rate, which is a good sign.
If this follows the historical playbook, expect chop through September, a strong October and November, then give some back in December.
This is an absolutely crazy stat.
Someone asked about factoring in oil, bonds, and Japan into the current tech selloff.
So I pulled the data for every single time oil surged 10%+ in a month while bonds AND Japan were both negative. There's been 29 times this has happened since 2000.
Here's what $QQQ did next:
• 1 month: +0.9% median (61% win rate)
• 3 months: +4.5% median (75% win rate)
• 6 months: +9.8% median (78% win rate)
• 1 year: +9.7% median (67% win rate)
Also for $SPY:
• 1 month: +0.8% median (64% win rate)
• 3 months: +2.5% median (75% win rate)
• 6 months: +7.3% median (70% win rate)
• 1 year: +7.2% median (67% win rate)
The near term is choppy. 1 month is basically a coin flip. But 3 months out, 75% win rate for both QQQ and SPY. 6
months out, QQQ averages nearly 10%.
You have a 75% chance of being green in 3-months and a year's time.
This is insane.
Every single time the S&P 500 was within 3% of all time highs while the Nasdaq was down 8% or more, the market rallied.
This has only happened 10 times since 2000. We're in one right now.
QQQ forward returns after this divergence:
• 1 month: +4.5% median (78% win rate)
• 3 months: +8.0% median (89% win rate)
• 6 months: +11.1% median (89% win rate)
• 1 year: +13.3% median (100% win rate)
SPY forward returns:
• 3 months: +6.0% median (100% win rate)
• 6 months: +7.4% median (100% win rate)
• 1 year: +14.3% median (100% win rate)
SPY has never been lower 3 months, 6 months, or 1 year after this signal. Not once in 26 years.
When the broad market is near highs but tech is selling off, that's rotation, not recession. Tech always catches up.
So what should you do? Buy low when people are scared.
These are how bottoms are formed.
2025 Tariff
1. Huge volume at the lows
2. 12% rally in one day
3. Higher-low
4. Gap up and follow-through
2022 Banking Crisis
1. Huge volume at the lows
2. Gap up and follow-through
3. Higher-low established
2020 COVID Crash
1. Huge volume
2. Gap up and follow-through
3. 2nd gap up and follow-through
We need huge volume, we need gap-ups and follow through days.
No bullshit. Only strength.
@DrD3131@asklivermore Personally with Iran and US not coming into full agreement and Iran consistently lying about an agreement I see short term bears coming into play. I think we see 677?again before popping up. That’s just my analysis
Here's exactly my game plan, and which sectors I'm planning to buy and hold:
So far since the start:
• Our core portfolio is up +1.77%
• $SPY is down -1.10%
• $QQQ is down -6.40%
• $XLK is down -7.85%
• $SMH is down -14.65%
Stocks I've bought:
1. I added to my Mag 7 position
2. I bought stocks in the insurance and retail grocery sector - historical compounders that stay strong
3. I bought a few technology stocks like $ARM for the long-term, they are the toll-both of technology
Current portfolio:
1. I am staying balanced with Mag 7's, financials, healthcare, software and AI infrastructure stocks
2. I will start to become overweight in technology once a full-low is confirmed on ETFs like SMH, DRAM, and XLK.
Let's continue to outperform and rotate into names at lows.
The drone industry is trying to find a low. Larger volume coming in last few weeks, specifically for Ondas.
Looks like some institutions are buying drone stocks / military defense ETF around these areas.
$ONDS, $UMAC, $AVAV, $KTOS
Still no confirmation yet, could take a few months for accumulation. But these are the levels you start becoming interested again.
AI stocks and software stocks might finally go up together again.
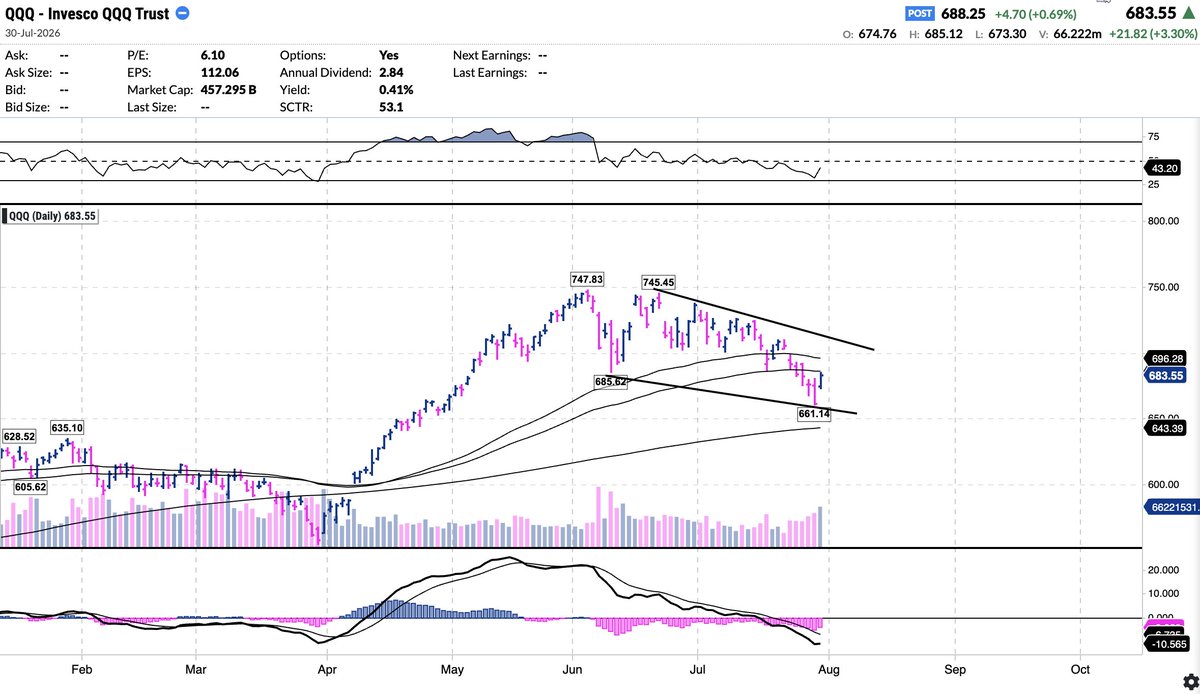
Both $QQQ and $XLK (pure tech ETF), are forming wedges, typically a breakout candidate for the future.
$IGV (software ETF) is trying to put in a low.
Still no confirmation, but off to a strong start.
Now we need follow-through on both sectors together.
Let's see over the next sessions how things play out or if this is all fake.
Today AI stocks are ripping 10-20%+ after 6 straight days of red in $QQQ and $XLK.
Everyone is asking me if this is a real bottom, or a fake-out.
This is what we need moving forward:
Fake Rally:
• One monster green day
• Mostly short covering
• Volume is okay but not explosive
• Only a few AI names leading
• Fails to reclaim key moving averages
• Then it rolls over and makes new lows
True Bottom:
• Strong volume that matches or beats the selling days
• Follow-through day (big % up on higher volume after day 3-4 of the bounce)
• Broad participation across semis, software, cloud… not just 3-4 sectors
• Holds the low and starts printing higher lows
• Earnings actually proving the AI spend is working (like Microsoft today)
• Market structure starts healing
One big green day means NOTHING by itself.
I have seen this movie a hundred times. Relax and let the next sessions reveal itself. Let’s hope for more green and strength from the bulls 🙏
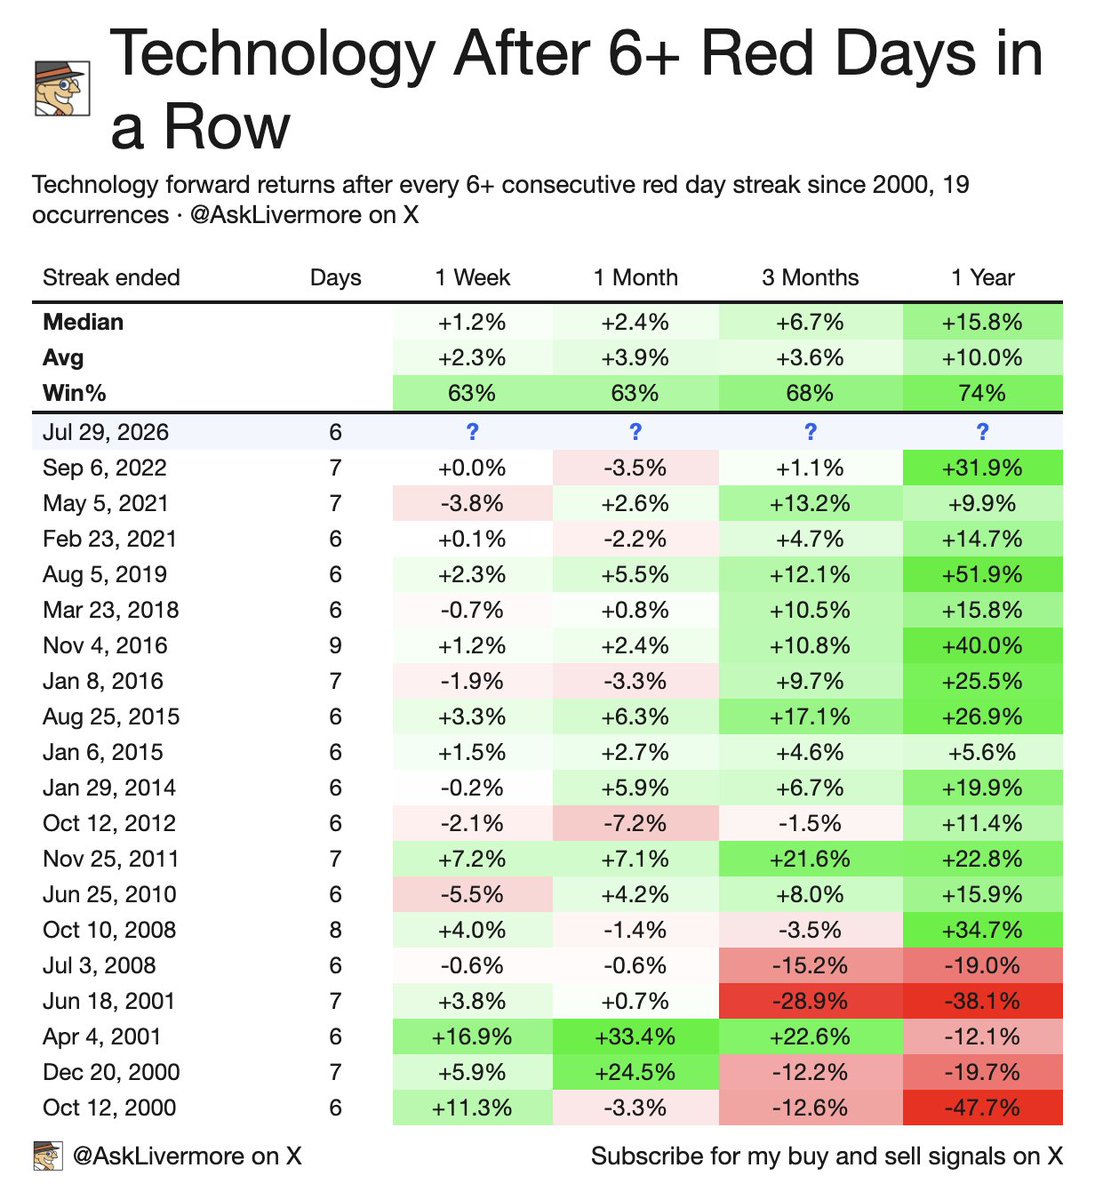
Technology closed red 6 days in a row yesterday.
Here's what happened next:
• 1 week later: +1.19% median return. 63% win rate.
• 1 month later: +2.38% median return. 63% win rate.
• 3 months later: +6.66% median return. 68% win rate.
• 1 year later: +15.85% median return. 74% win rate.
The only times tech was lower a year after a 6 day red streak were during the dot com bust and the financial crisis.
Every other time, significantly higher.
This is the part that separates the people who make money from the people who don't. The sellers right now are handing their shares to the buyers who will hold them 12 months from now at significantly higher prices.
Never be sad or scared. Always be happy you have a chance to change your life.