Gapki palm oil demand supply 6/2026
Weird things happened Again !!!
Similar with last year's supply again !?
Mar - Jun Y2026 = supply in Y2025 !?
supply : Mar Apr May Jun
Y25 : 4811 4908 4563 5292
Y26 : 4825 4908 4557 5280
The Renewable Fuels Association is highlighting an older DOE report as it makes the case against expanding small refinery exemptions.
The report, released in July and based on April prices, found E15 averaged 47 cents/gal less than E10 — an 11.5% discount. RFA says the data show ethanol can lower pump prices.
@EthanolRFA President Geoff Cooper: “American drivers who have access to E15 are saving real money with each fill-up.”
Cooper also argues that “undermining the RFS with small refinery exemptions” would reverse that progress and lead to higher pump prices.
EPA issued a notice this morning that it is delaying 2025 compliance and is going to issue 2025 SREs by the end of the month.
Kudos to @JarrettRenshaw
I had not gotten word that this was being materially discussed by EPA until first thing this week.
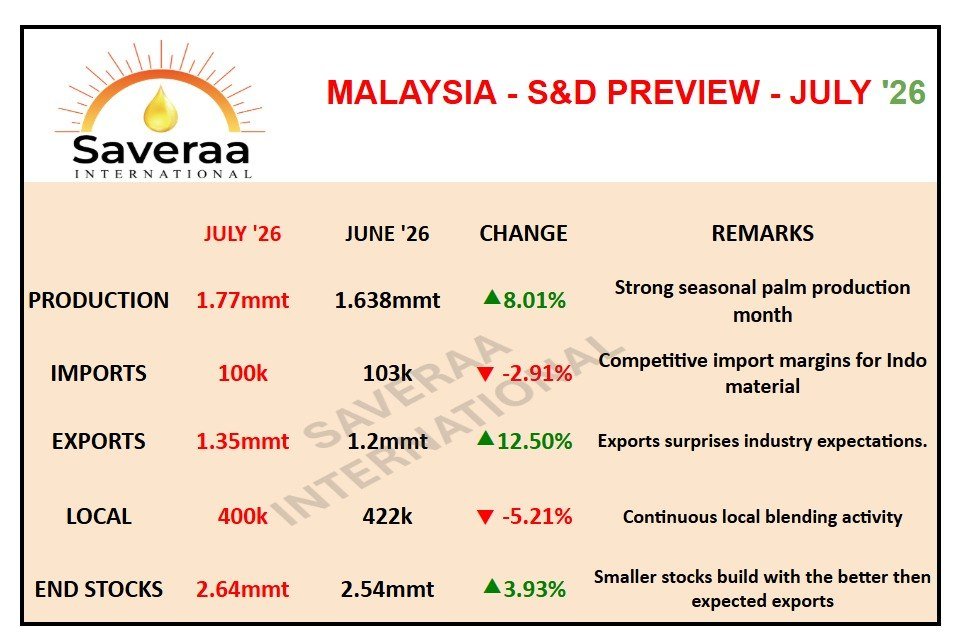
1/ June #MPOB report: Palm oil stocks hit 2.54 million tons (+25% YoY), a record for June. Looks bearish on the surface. But there are three "data traps" here that fooled most people. 👇
2/ Trap 1: The so-called "37% jump in domestic consumption" doesn't mean local demand is getting stronger. It's just a residual item in the balance sheet. Do the math with the supply-demand equation, and you'll see it merely absorbs the extra production and imports. Reading this as bullish demand is the biggest mistake this month.
3/ Trap 2: Imports skyrocketed by 135%—the weirdest number in the report. The real reason? Indonesia raised its #CPO export levy to 12.5% in March, giving Malaysia a $103/ton cost advantage. Cheap Indonesian oil flooded Malaysian refineries for a month. This is just a short-term arbitrage trade, not a long-term trend. It will likely drop next month.
4/ Trap 3: The 8% production growth looks good, but it's only half of what SPPOMA data (+16.74%) suggested. Also, this year's output growth is entirely driven by a higher oil extraction rate (OER). Actual fresh fruit bunches (#FFB) already fell 3.1% YoY from January to May. The supply base is shrinking. Once El Niño hits, output could drop sharply.
5/ The 1.2 million tons in exports missed all forecasts, mostly because India's imports fell to a 14-month low in June. However, the continuous drop has stopped. July 1-25 data from AmSpec shows a 5% recovery. Real demand isn't as terrible as the high stock levels make it seem.
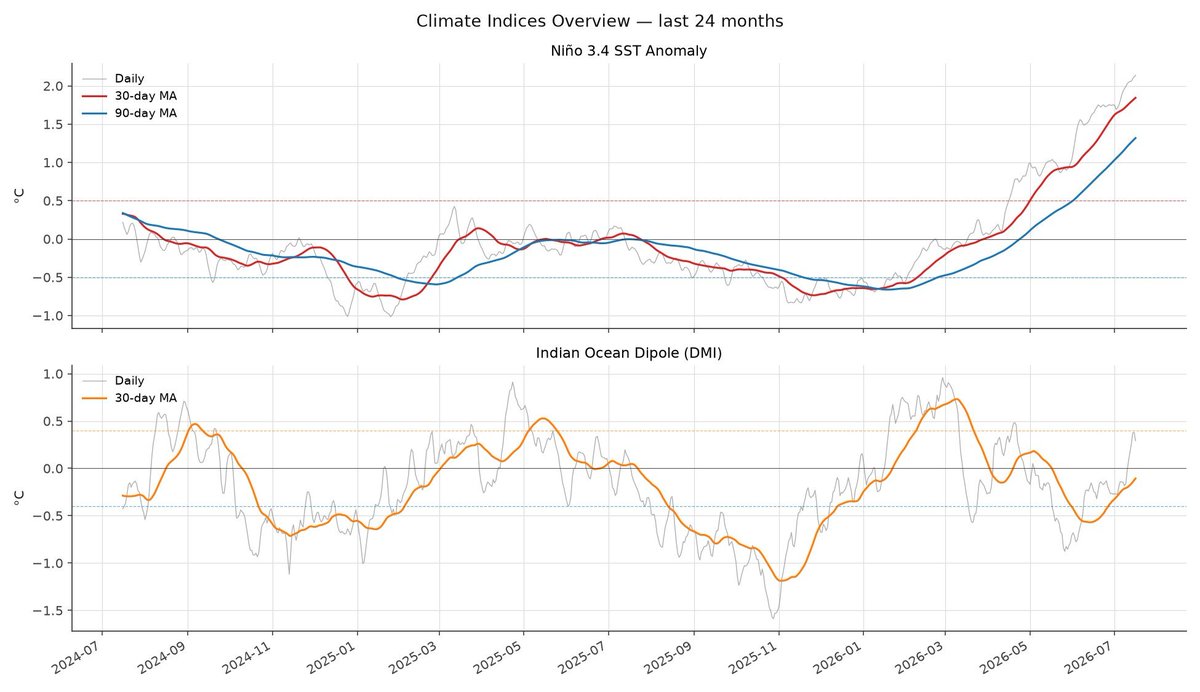
6/ The real driver is in the future: Indonesia's B50 mandate (started July 1, eating up 3-3.5 million tons of palm oil a year at full capacity) plus official El Niño warnings of an 8-10% output drop (impact delayed to 2027). The market is loose now, but it will tighten up later.
7/ Conclusion: Weak reality, strong expectations. Near-term prices will chop around 4400-4650. The downside is protected by the MPOC policy bottom and the long-term tightening story. The overall structure is bullish—buy the dip. The biggest plot twist? July inventory might drop instead of rising. That's a wild card the short sellers haven't priced in yet.
Gapki palm oil supply demand in March 2026
Production: Mar < Feb !?
Huge ~700k mt difference !?
How to read such Fundamental data !!!
What will be Apr & May when due to release ?