Once a trend is established, it tends to persist and run its full course.
The object is to recognize the trend, ride the trend, and step off before it is discredited.”
— George Soros
UK/EU Session Update: #EURCHF tests major resistance.
0.9200 was very important support and now could show as very important resistance.
A break targets the 200 DMA at 0.9231 before another strong prior level 0.9255/70.
Support over the last 3 days has been down at the 100 DMA, currently at 0.9153.
After that it's 0.9130/35
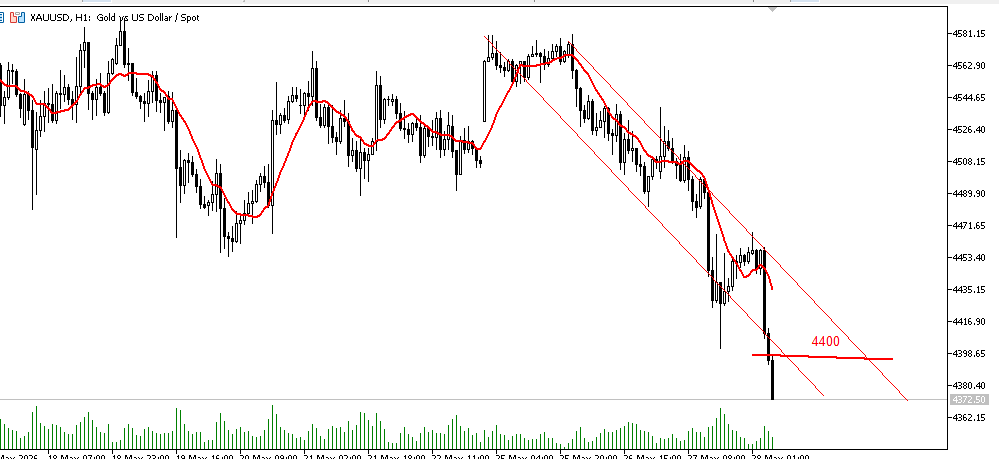
On May 28, 2026, gold (XAU/USD) is currently fluctuating around $4,373, exhibiting a clear short-term accelerated decline.
Technical Analysis:
1. Clear Bearish Pattern and Breakout
From the candlestick chart you provided (with moving average indicators), we can see:
Accelerated Breakout: Gold prices previously traded in a narrow rectangular range around $4,500 for a period. However, recently, the candlestick broke through the previous key support level and broke through the psychological level of $4,400 with consecutive large bearish candlesticks.
Moving Average Resistance: The red moving averages (MA) in the chart show a downward sloping death cross bearish pattern. Currently, the candlestick is completely below the moving averages, and the deviation from the moving averages is widening, indicating a rapid increase in bearish volume and strong downward momentum.
2. Key Support and Resistance Levels
Key Support:
$4,370 - $4,375: This area is not only a significant historical consolidation zone since October of last year, but also a key strategic test line for the current weekly 200-day moving average (200 EMA). If this level is substantially broken on the daily chart, further downside potential will open up, potentially sliding towards $4,250 or even $4,100.
Intraday Resistance:
$4,400: This has transformed from a previous support level into the first psychological resistance level for the day. Trading should follow the trend, continuing to focus on sell orders! #XAUUSD #FED
UK/EU Session Update: As per prior update, unconvincing. #XAUUSD can't capitalise on lower yields for the moment, which could leave it vulnerable for that 4380/4410 test. Unless it can break above 4590, opening the sky for 4675/4705.
US Session Update: The US Dollar index came within 4 pips of the March 30th highs to April 17th lows 61.8% retracement at 99.51. This will be critical resistance intraday since this also would fill the gap from the April 7th gap. A break above this level would be very bullish for the dollar. $DXY
US oil price action today was nuts today.
WTI dropped as much as -13.6% at the days low and looking to end the day down around -6.3%
Tthe reactionary and skeptical elements of US-Iran headlines drive this volatility.
Second biggest 'lower wick' on record:
@Kerry0nan@FundedNext No they as per rules trades should be closed at weekends .if traders do not close the trade then fundednext closes it automatically