Learn how to analyze Airbnb markets using the Airbtics Market Dashboard. Find profitable neighborhoods, property types, and real listing performance in minutes.
👉 Try Airbtics: https://t.co/SG5hiR9k3f
👉 App dashboard: https://t.co/icbuB7cUhD
https://t.co/MLySDVpaRA
New in Airbtics: Comps Benchmark 🚀
Build a competitor set once.
Track Airbnb comps across:
• pricing
• demand
• bookings
• reviews
No more checking listings one by one.
We’re giving 1 free Comp Set to users who sign up before July 1 — includes intelligence on up to 20
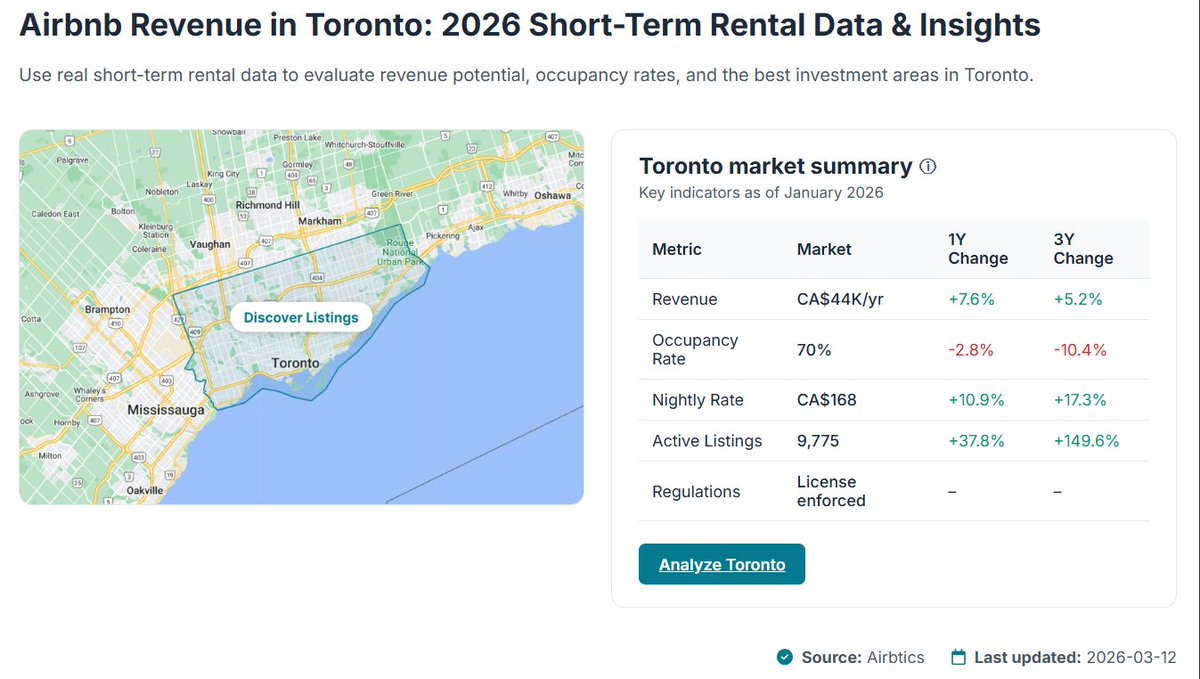
Toronto Airbnb Market Overview – 2026 Data
Average annual Airbnb revenue: CAD$44K
Occupancy rate: 70%
Average nightly rate: CAD$168
Active listings: 9,775
Regulations: License enforced
See the full Toronto Airbnb data dashboard: https://t.co/VH1DCoYoba
#AirbnbToronto
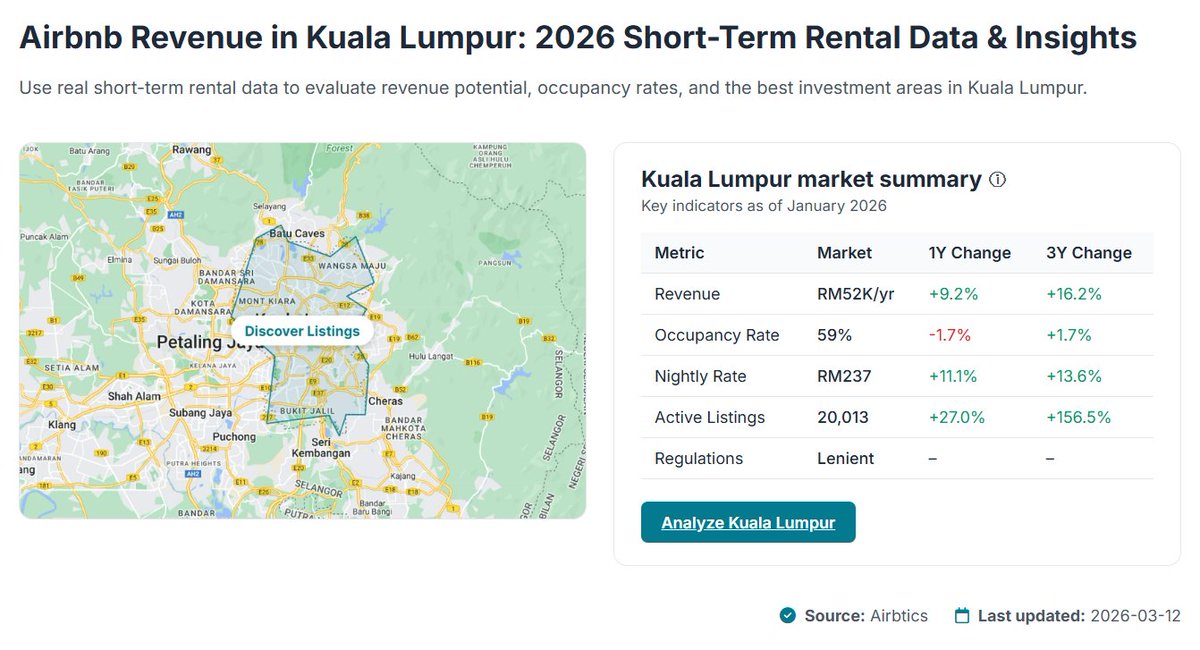
Kuala Lumpur Airbnb Market Overview – 2026 Data
Average annual Airbnb revenue: RM52K
Occupancy rate: 59%
Average nightly rate (ADR): RM237
Active listings: 20,013
Regulations: Lenient
See the full Kuala Lumpur Airbnb data dashboard: https://t.co/zPTQmNG2kj
#AirbnbMalaysia
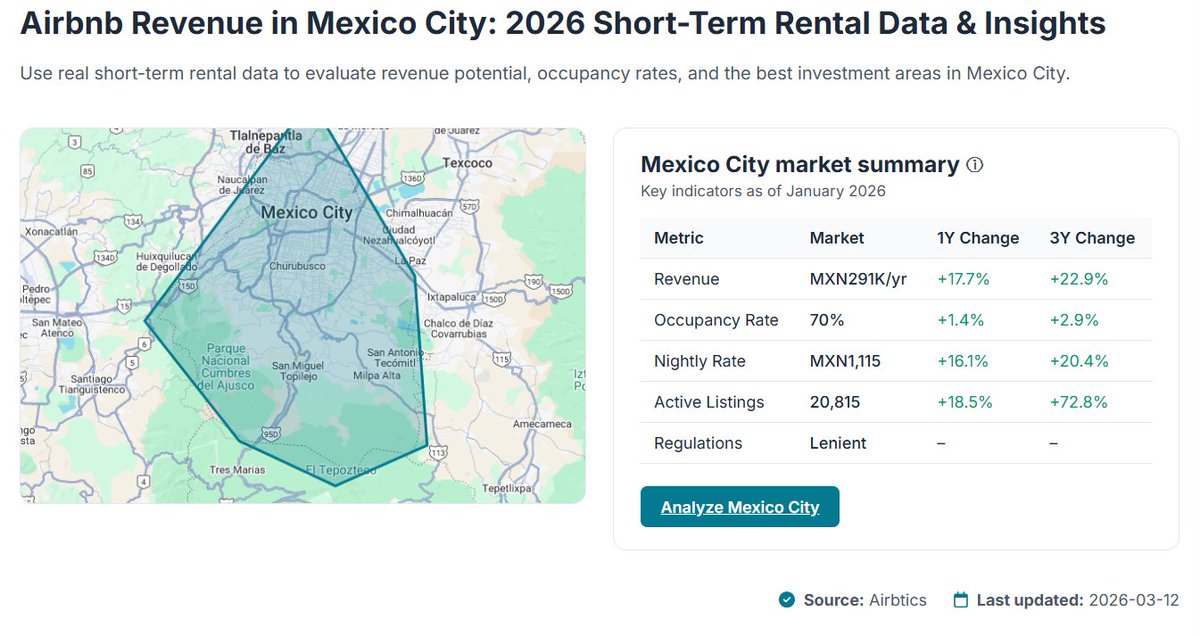
Mexico City Airbnb Market Overview – 2026 Data
Average annual Airbnb revenue: MXN291K
Occupancy rate: 70%
Average nightly rate (ADR): MXN1,115
Active listings: 20,815
Regulations: Lenient
See Mexico City Airbnb data dashboard: https://t.co/xI3lUnh06f
#AirbnbMexico
Milan Airbnb Market Overview – 2026 Data
Average annual Airbnb revenue: €36K
Occupancy rate: 73%
Average nightly rate (ADR): €131
Active listings: 16,976
Regulations: License enforced
See the full Milan Airbnb data dashboard: https://t.co/TMjn5pHsSG
#AirbnbMilan
Metro Manila Airbnb Market Overview – 2026 Data
Average annual Airbnb revenue: ₱395K
Occupancy rate: 49%
Average nightly rate (ADR):
Active listings: ₱2,135
Regulations: Lenient
See the full Metro Manila Airbnb data dashboard: https://t.co/U68ViCugPO
#AirbnbManila
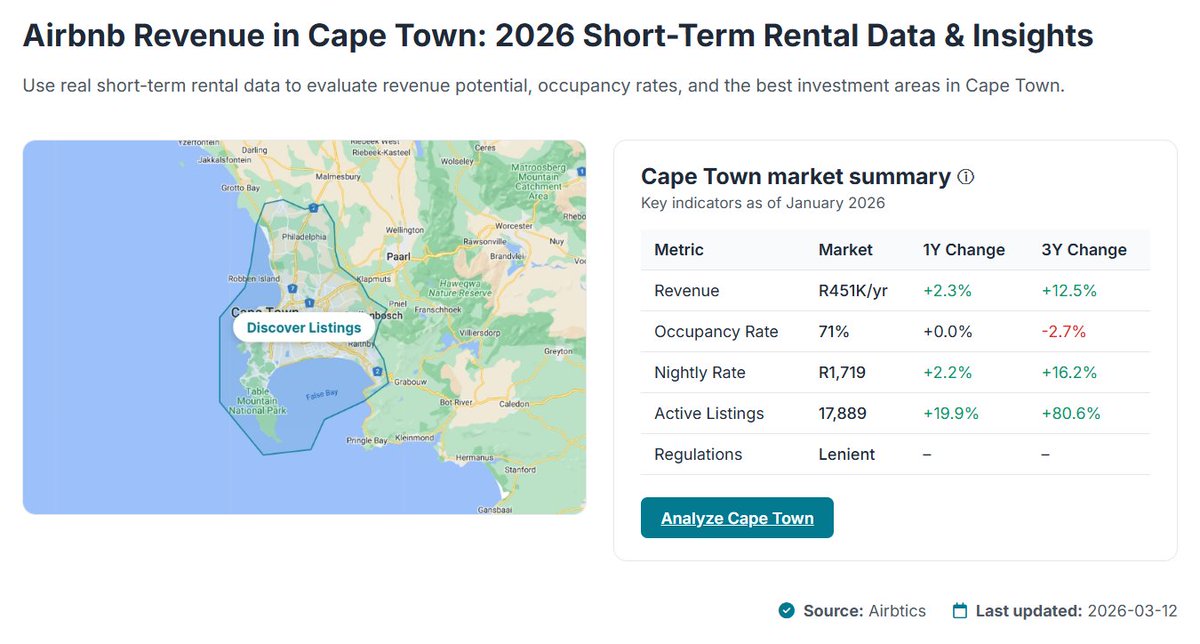
Cape Town Airbnb Market Overview – 2026 Data
Average annual Airbnb revenue: R451K
Occupancy rate: 71%
Average nightly rate (ADR): R1,719
Active listings: 17,889
Regulations: Lenient
See the full Cape Town Airbnb data dashboard: https://t.co/RSXTpm5pHj
#AirbnbCapeTown
Istanbul Airbnb Market Overview – 2026 Data
Average annual Airbnb revenue: TRY486K
Occupancy rate: 59%
Average nightly rate (ADR): TRY2,201
Active listings: 13,076
Regulations: License enforced
See the full Istanbul Airbnb data dashboard: https://t.co/HKqQ7aPHjl
Sao Paulo Airbnb Market Overview – 2026 Data
Average annual Airbnb revenue: R$57K
Occupancy rate: 61%
Average nightly rate (ADR): R$245
Active listings: 31,222
Regulations: Lenient
See the full Sao Paulo Airbnb data dashboard: https://t.co/IWBn3fMJfg
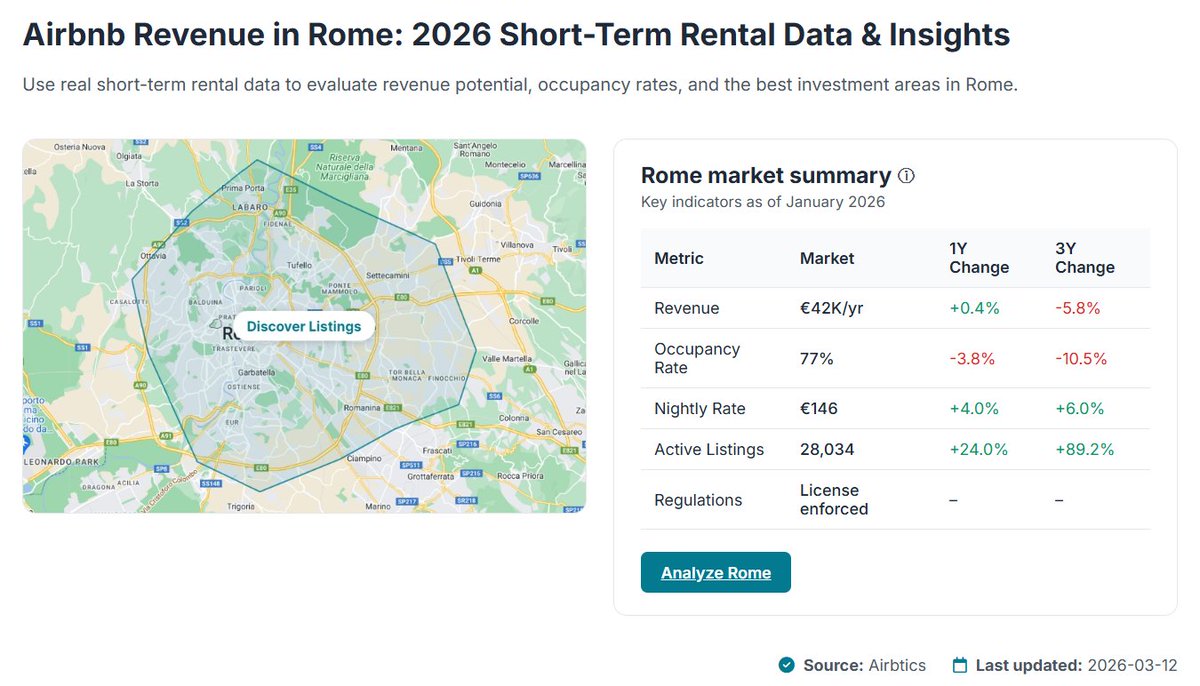
Rome Airbnb Market Overview – 2026 Data
Key metrics for the Rome short-term rental market:
Average annual Airbnb revenue: €42K
Occupancy rate: 77%
Average nightly rate (ADR): €146
Active listings: 28,034
See the full Rome Airbnb data dashboard: https://t.co/gGHAw9cmR9
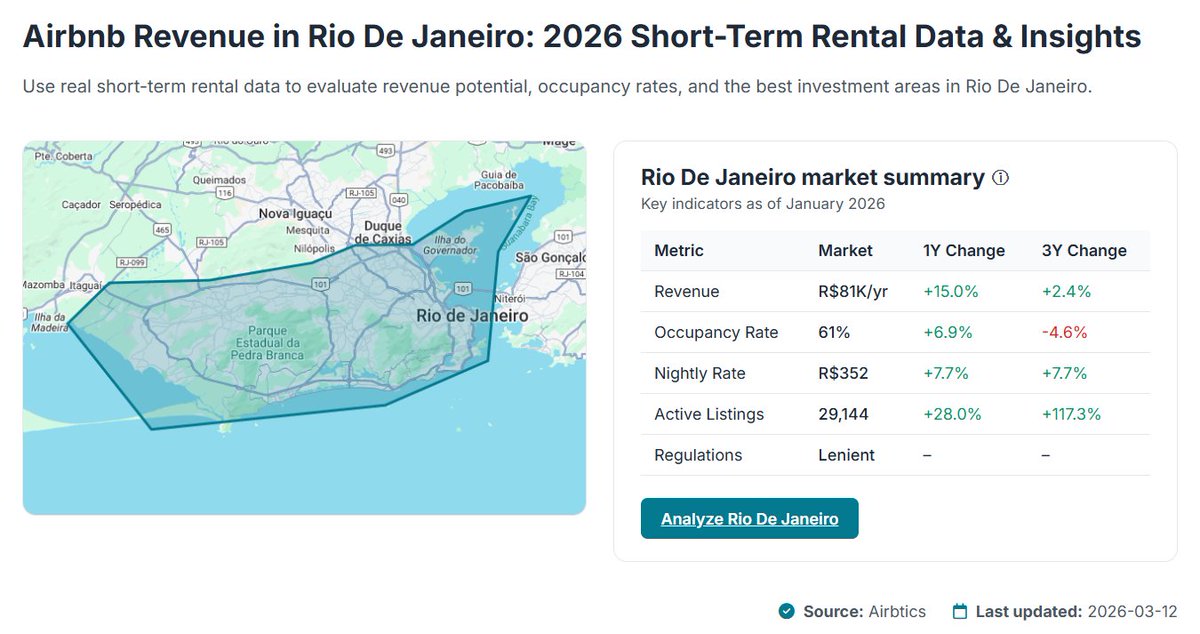
Rio De Janeiro Airbnb Market Overview – 2026 Data
Average annual Airbnb revenue: R$81K
Occupancy rate: 61%
Average nightly rate (ADR): R$352
Active listings: 29,144
Regulations: Lenient
See the full Rio De Janeiro Airbnb data dashboard: https://t.co/5YRAqLrUU8
#airbnbbrazil
Dubai Airbnb Market Overview – 2026 Data
Key metrics for the Dubai short-term rental market:
Average annual Airbnb revenue: AED172K
Occupancy rate: 73%
Average nightly rate (ADR): AED638
Active listings: 22,719
See the full Airbnb data dashboard: https://t.co/q3XvE5hA3s
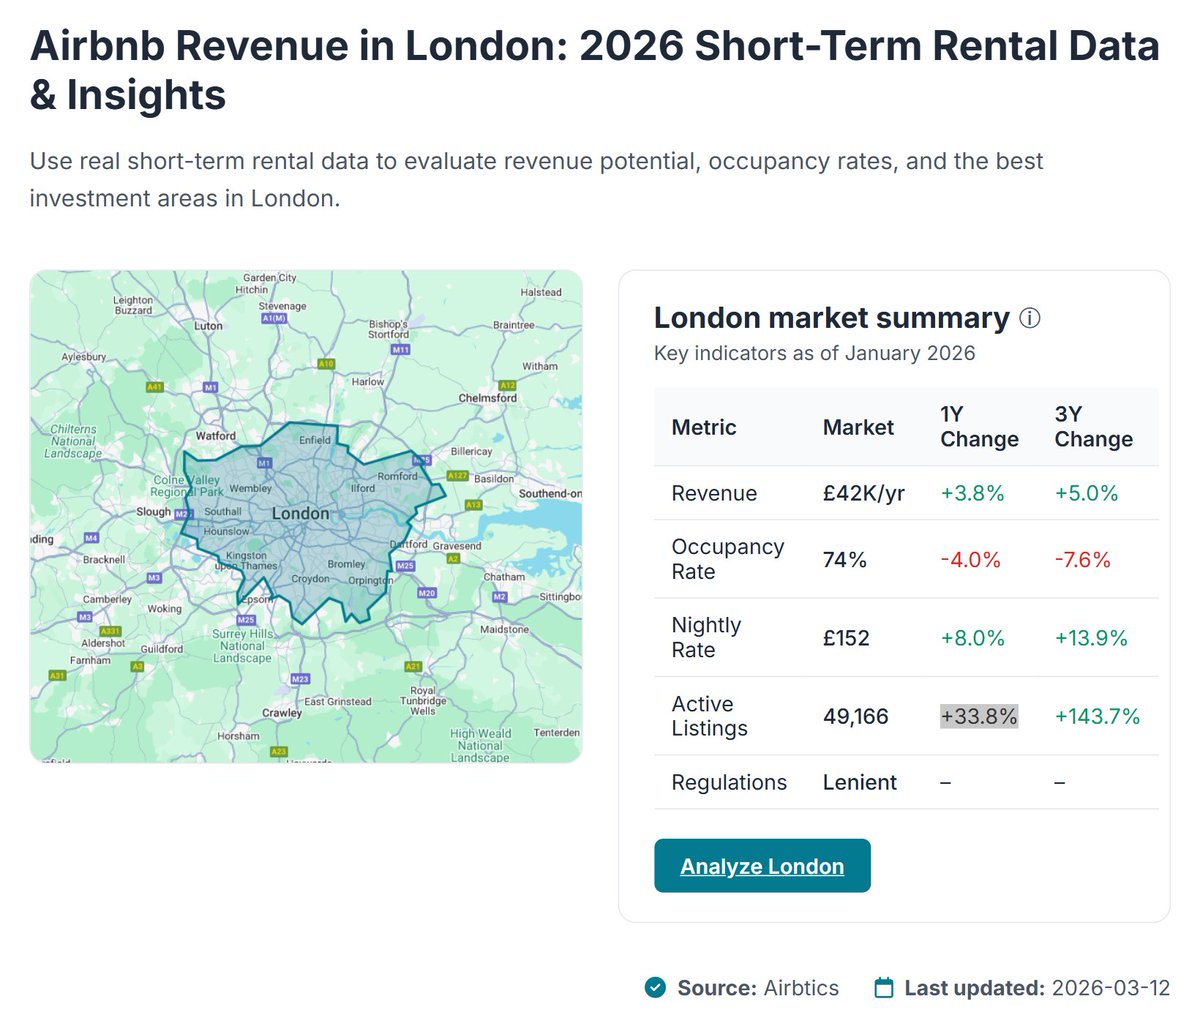
London Airbnb Market Overview – 2026 Data
Key metrics for the London STR market:
Average annual Airbnb revenue: £42K
Occupancy rate: 74%
Average nightly rate (ADR): £152
Active listings: 49,166
Regulations: Lenient
See the full Airbnb data dashboard: https://t.co/ZlYxhnfcOi
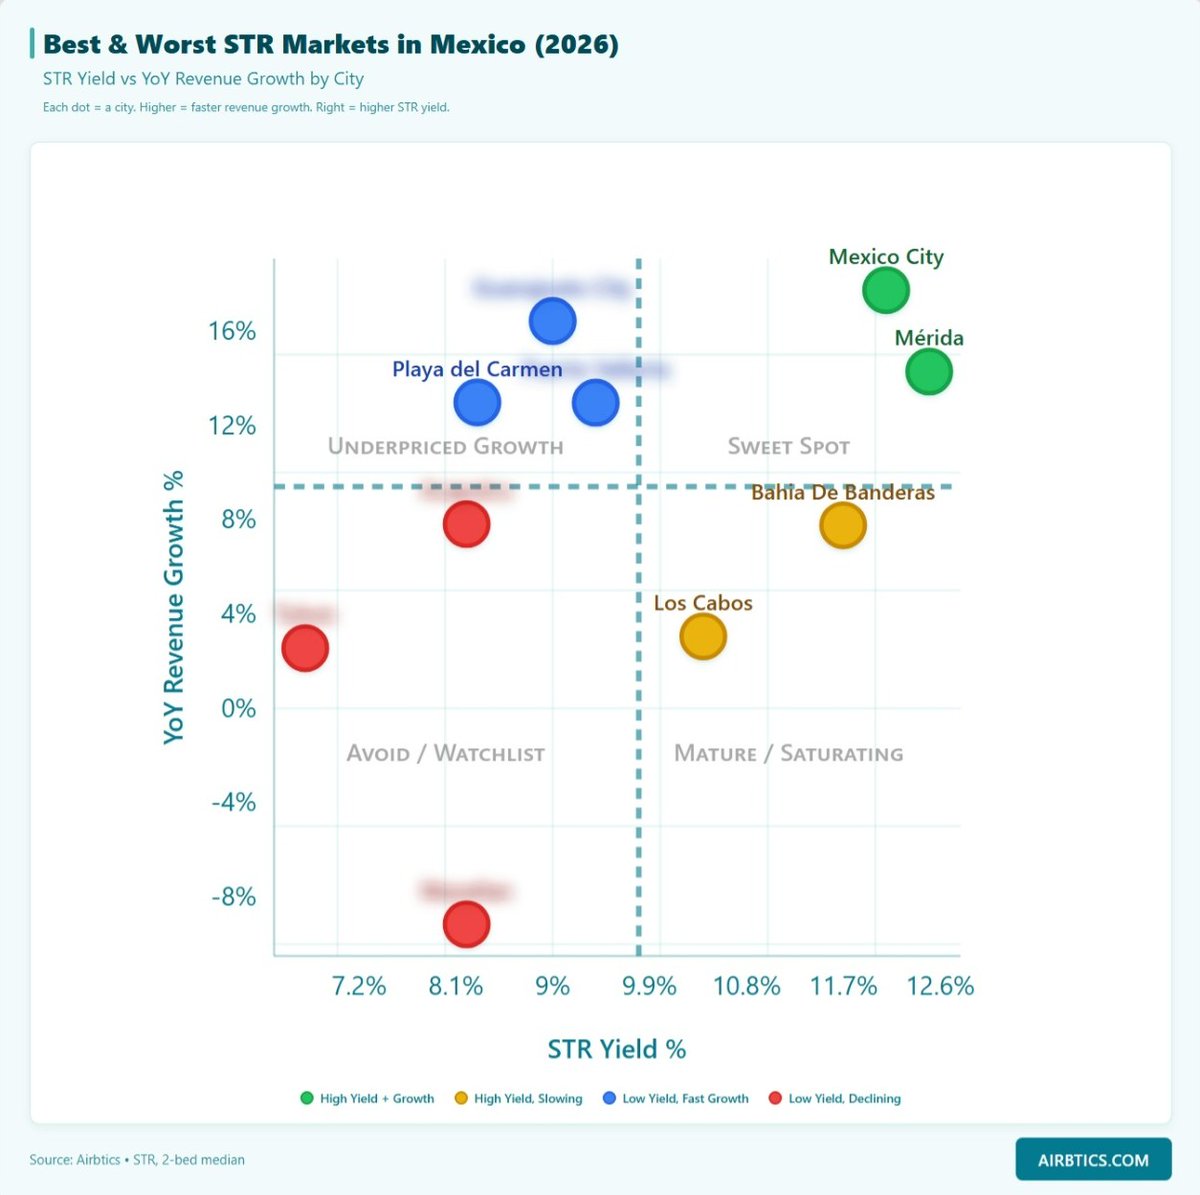
Mexico’s STR market shows strong growth in popular tourist hubs, while major cities remain steady in performance.
Cancún + 12.5% STR yield ⠀
Playa del Carmen + 11.8% STR yield ⠀
Mexico City + 7.4% STR yield ⠀
Read full report:
https://t.co/OCZ4fv9zqj
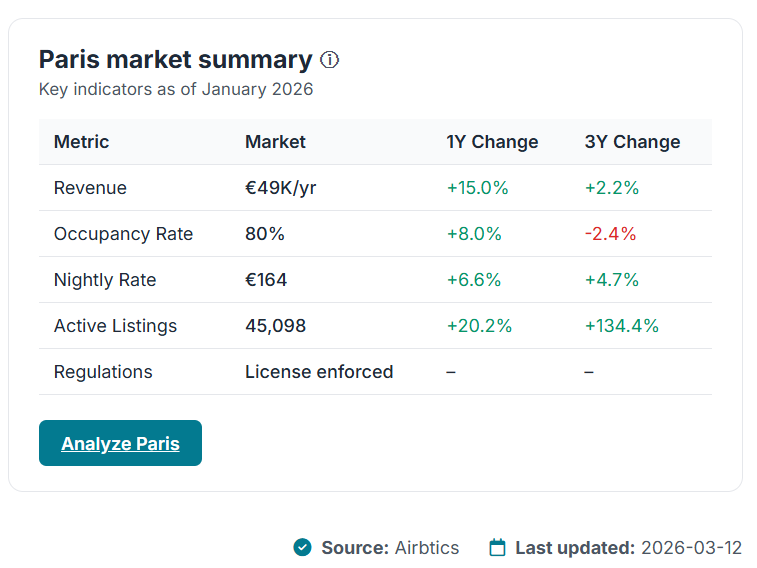
Paris Airbnb Market Overview – 2026 Data
Key metrics for the Paris short-term rental market:
Average annual Airbnb revenue: €49K
Occupancy rate: 80%
Average nightly rate (ADR): €164
Active listings: 45,098
See the full Paris Airbnb data dashboard: https://t.co/9H7Fg6v74w
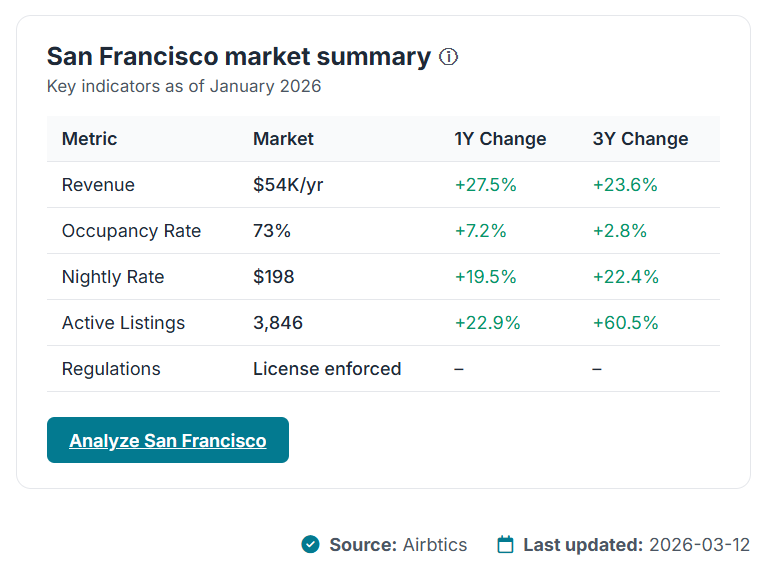
San Francisco Airbnb Market Overview – 2026 Data
Key metrics for the San Francisco STR market:
Average annual Airbnb revenue: $54K
Occupancy rate: 73%
Average nightly rate: $198
Active listings: 3,846
See the full Airbnb data: https://t.co/Hiid5A4Gp6
#AirbnbSanFrancisco
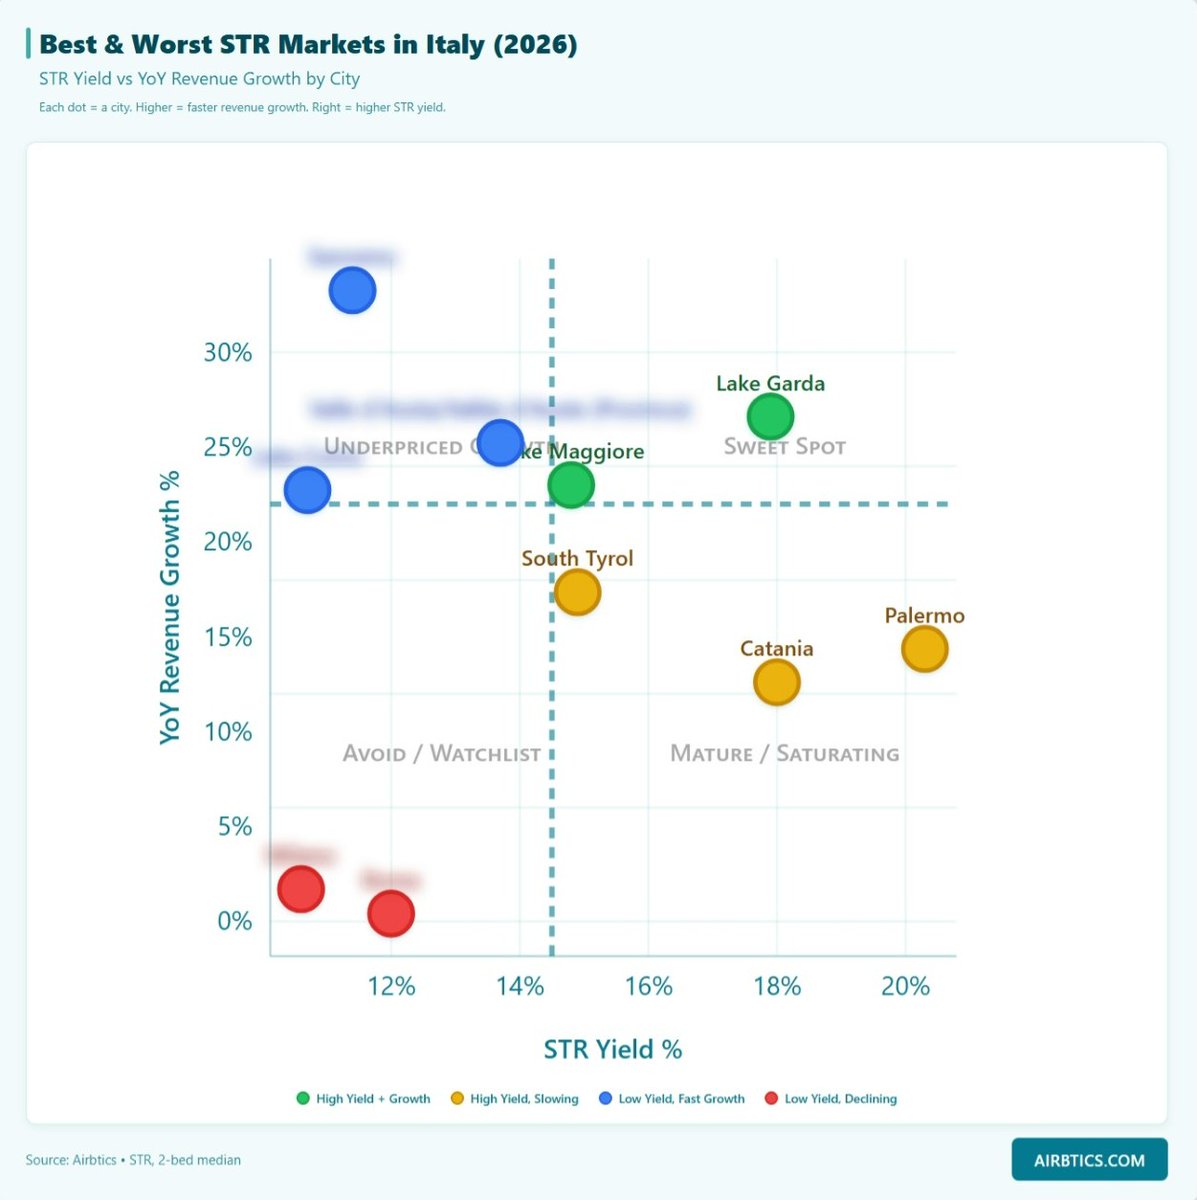
Italy’s STR market is still growing, but rising supply is starting to pressure revenue in major tourist cities.
Florence -2% YoY revenue ⠀
74% occupancy
Rome −4.7% YoY rev.
77% occupancy
Milan -2.7% YoY rev.
73% occupancy
Read full report:
https://t.co/nlBFr8CY2E
Brazil’s STR market continues to grow fast, with strong revenue growth despite rising supply across major cities.
São Paulo +12.08% YoY revenue ⠀
Rio de Janeiro +13.22% YoY revenue ⠀
Read full report:
https://t.co/K0vU0M3QQ9
#AirbnbData#ShortTermRental#STRMarket
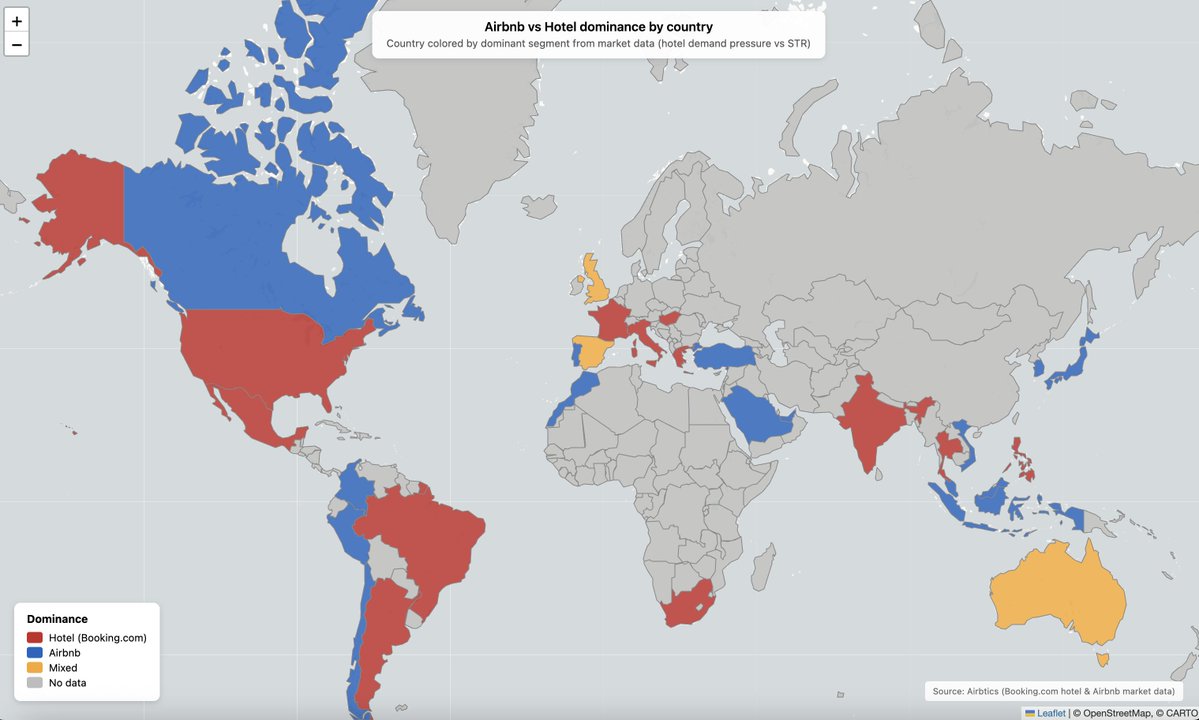
Airbnb vs Hotel - Market Occupancy Rate analysis! This map compares hotel demand pressure vs Airbnb occupancy across countries, based on market-level data from 1,600+ cities worldwide.
You can explore the underlying hotel occupancy data by city here:
https://t.co/FtSHZDy1wW