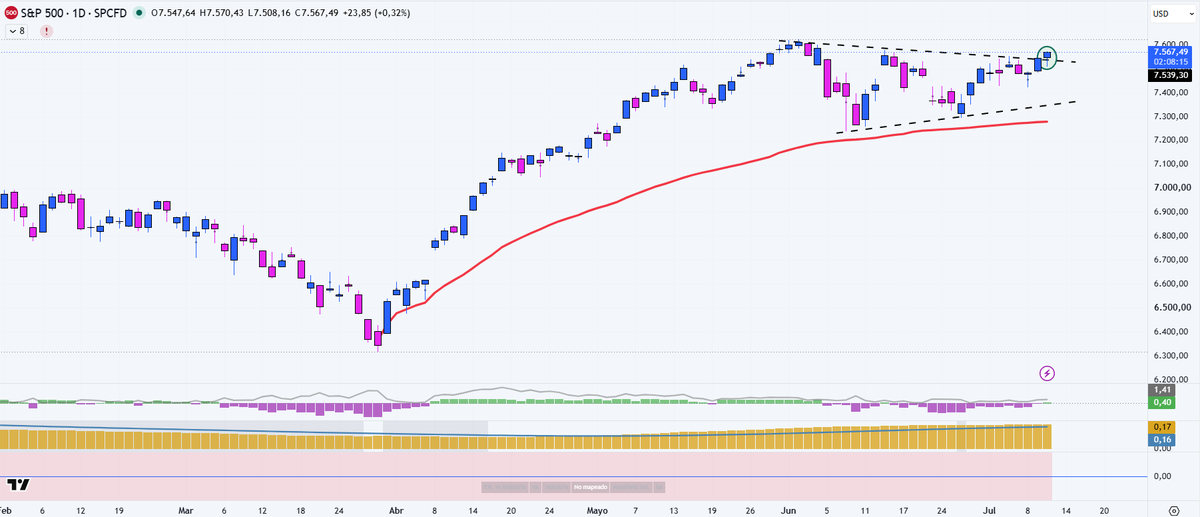
SP500 OBJETIVO 🎯8.000 PUNTOS
SP500 rompiendo un triangulo 📐 al alza! Esa vela de hoy no parece bajista para los mercados ni mucho menos! 🟢🚀
Aun asi poco a poco vigilar no perder los 7.270 donde pasa el AVWAP desde minimos de marzo.
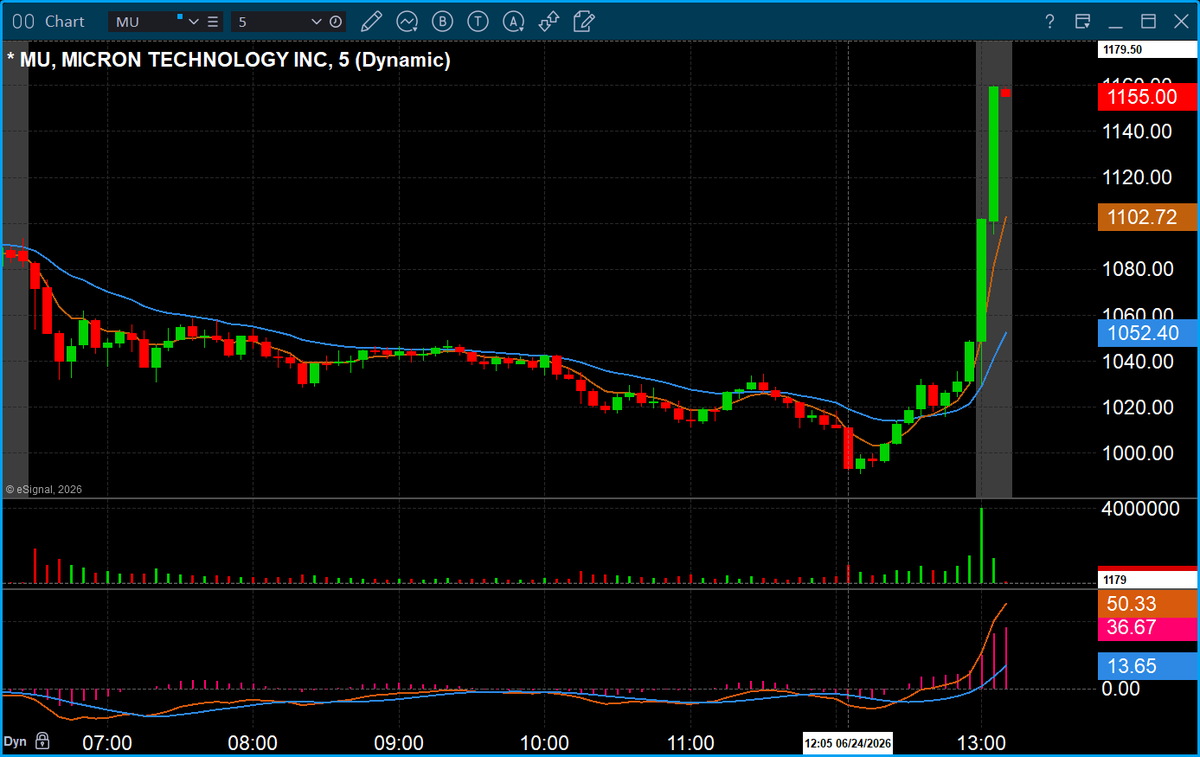
$MU +170% in 2 months 2 weeks of holding swing position just following a simple 10-MA sell rule and refusing to let daily price swings dictate decisions. Even through a -6% day on May 18 and a -13% pullback on Jun 5, the sell rule remained intact.
The only way to know you are positioned in a leadership stock is that it doesn't violate the 10-MA sell rule. Most of the money wasn't made by finding the stock. It was made by having a framework that allowed the position enough room to work.
PS: 10-MA sell rule: it can kiss, it can under cut, it can closed below, but it can't do a lower low beneath it. Don't expand this to 20-MA, there's too much unrealized profit loss and creates widen drawdown to your equity curve.
So much pessimism ahead of $MU earnings, you almost thought somebody knew something. As it turned out nobody knew anything and $MU bounces off 20-dema support in the after-hours to save the day.
If today wasn't THE TOP at the very least it needs to build out of new base. $WDC
$STX also showing some relative weakness compared to $MU $SNDK today.
Mi último año consolidando el portfolio de sistemas de trading. Última incorporación al equipo, el sistema de ponderación de coberturas, en automático!!
Para mí esto es un hito. Seguimos creciendo. Mucho es ya lo aprendido, más es aún lo que queda…
It is a short-term breadth oscillator measuring the number of stocks making 20% moves up or down in the last 5 days.
Extremely high bullish readings trigger market pullbacks, and extremely bearish readings trigger bounces.
Buerish signal takes 3 to 5 days to activate. A bullish signal typically works immediately.
It is calibrated based on past data.
Not a good look for the S&P500. From failed moves can come fast moves.
We are in this range that has been contracting to the upside since 2025. And the upward-trending volatility contraction could lead to the final AI blow off when the trend lines eventually pinch at the top right.
For the time being, if this range continues to hold, we could see 6800-7000 before another leg higher.
NASI is just hooking about, and the RSI isn't even in overbought territory yet.
Honestly, quite incredible.
We are starting to feel the leaders and breadth expand in a big way, and money flowing into many themes instead of just mega caps, semis, memory, and optics.
@VictorG_bolsa Que opinas sobre $CSX ?
Demasiado extendida o una rotura con probabilidad estadística a favor?
Pdta: ya tengo sistema GAP casi automatizado!!