BTC just did something it hasn't done since the downtrend started last October.
3 different methods, one conclusion: my HTF bias is now bullish. And I'm already setting up the trade.
Full multi time frame breakdown + trade setup below 👇
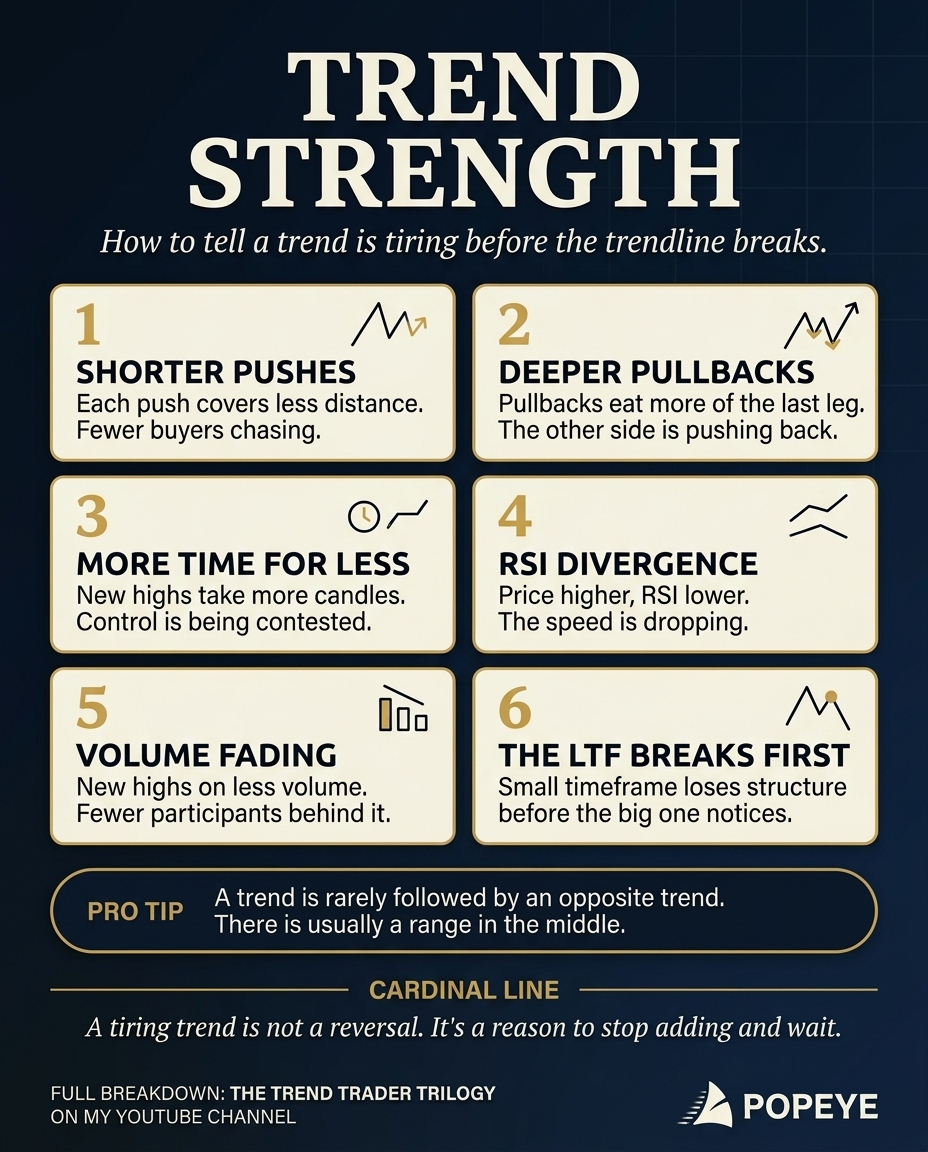
TREND STRENGTH: HOW TO TELL A TREND IS TIRING BEFORE THE TRENDLINE BREAKS - CHEAT SHEET
You voted, I delivered! Took me longer than promised, but here it is.
The trendline break is the last thing to happen, not the first. By the time it breaks, the move is usually already over. These are the 6 things I watch before that.
1. SHORTER PUSHES
Each new impulse covers less distance than the one before.
WHY: every push needs fresh buyers. When each leg gets shorter, fewer new players are willing to chase at higher prices. Same effort, less result.
2. DEEPER PULLBACKS
Pullbacks start eating more and more of the last leg.
WHY: in a healthy trend, sellers get absorbed fast and pullbacks stay shallow. Deeper pullbacks mean the other side is finally strong enough to push back.
3. MORE TIME FOR LESS
New highs take more and more candles to print.
WHY: strong trends move fast because one side is in control. When price starts grinding, that control is being contested.
4. RSI DIVERGENCE
Price makes a higher high, RSI makes a lower high.
WHY: RSI measures the speed of the move. Price can keep going up while the speed drops, like a car still rolling forward after you lift your foot off the gas.
Full breakdown: https://t.co/TW0RriFXKy
5. VOLUME FADING
New highs print on lower and lower volume.
WHY: volume is the effort behind the move. Higher price with less effort means fewer participants are backing it.
Full breakdown: https://t.co/NMYMDXA1nC
6. THE LTF BREAKS FIRST
The lower timeframe loses its structure (the first lower high in an uptrend) before the HTF trendline even notices.
WHY: every HTF trend is built from LTF swings. The change always shows up on the small timeframe first, the big one only confirms it later.
What it means: a tiring trend is not a reversal signal. It's a reason to stop adding, manage what you have, and wait.
PRO TIP: a trend is rarely followed directly by another trend in the opposite direction. Most of the time there is a range in the middle. So when a trend gets tired, don't rush to flip your bias. Prepare for the range first.
Want the full picture? I made a whole trilogy on trends on YouTube, The Trend Trader:
Part 1: How Trends Really Work
Part 2: My Exact Process for Trading Trend Pullbacks
Part 3: 5 Advanced Trend Signals
https://t.co/9mnsCYSqxB
Pop
@SailorManCrypto If the account is new and I still need to complete the challenge, should I still only take A+ setups? And if I want two attempts on the same trade idea, should I split the risk to 0.5% on each attempt, or is it better to skip the first attempt and wait for the second one with a full 1% risk?
As always great article, explains a lot. Thank you.
Deviations to Avoid - CHEAT SHEET
Not every range deviation is a signal. Most of the ones that lose money look almost right. 5 ways to tell you're looking at a trap instead of a trade:
1. THE RANGE ISN'T EVEN A RANGE YET. One touch on each side isn't a range, it's noise pretending to be structure. If you can't draw both boundaries in 5 seconds, there's nothing here to deviate from yet.
2. THE SWEEP HAD NO WEIGHT BEHIND IT. Price poked past the boundary on thin air, no volume, no reaction into a higher timeframe level. A real sweep takes liquidity. A fake one just drifts past the line and drifts back.
3. THE RECLAIM IS ONLY A WICK. The candle body never closed back inside, just the wick touched it and reversed. No reclaim, no trade.
4. NO STRUCTURE BREAK ON THE LOWER TIMEFRAME. The reclaim is the signal, not the trigger. If price comes back inside and just chops without breaking LTF structure, the setup never actually confirmed.
5. CALLING IT A SPRING OR UPTHRUST WITHOUT THE CONTEXT. Those only count at the real end of accumulation or distribution, with volume drying up or climaxing to match. Without that context, it's just a deviation.
The trap isn't the deviation. It's trading one that never had the weight, the reclaim, or the structure to back it up.
Save this one.
Pop
The 3 Drives Pattern Cheat Sheet
You voted for it. Here's how I trade it.
This educational thread is sponsored by @_WOO_X — where I trade crypto with zero fees on spot.
3 Drives is a reversal pattern. It signals exhaustion at the end of a trend. When you see it form clean, the trend is dying.
Two flavors:
Bullish 3-Drives → three higher highs → bearish reversal
Bearish 3-Drives → three lower lows → bullish reversal
Comes from Elliott Wave and Fibonacci, but I keep it simple.
The 3 textbook components.
Structure. Three sequential drives in the same direction.
In a bullish 3-Drives, you need three higher highs with higher lows between them.
In a bearish, three lower lows with lower highs between them.
No structure = no pattern.
Time.
Each drive should take roughly the same time to complete.
The textbook says exactly the same.
I say similar. If the first two drives form in 5 candles each and the third takes 15, the pattern is weakened or invalid.
Be flexible, not dogmatic.
Fibonacci.
Between drives, the pullback should retrace into the 0.618-0.75 zone — the golden pocket.
Each new drive should extend 1.27 to 1.618 of the previous.
Same flexibility rule.
Price doesn't move by textbook.
My pro tips.
The textbook gives you the pattern.
The pro tips give you the edge.
Trade it at known levels.
A 3-Drives in price discovery is much weaker than a 3-Drives running into a known resistance or supply zone.
The level gives the pattern a place to react from.
Pattern + level = confluence. Pattern alone = guess.
Add momentum. You want to see exhaustion.
RSI divergence is the cleanest signal — price making new highs while RSI prints lower highs.
Or volume drying up across the drives — less pressure on each push.
Either signal alone adds conviction.
Both = setup of the year.
How to trade it.
Two entry styles.
Pick your trade-off.
Aggressive entry — better price, riskier.
You enter at the end of the 3rd drive. Use the Fibonacci 1.27-1.618 extension or the S/R level to estimate where the drive completes.
The pattern is not confirmed yet — you're betting on the reversal.
Stop goes above the high (or below the low) of the 3rd drive.
Conservative entry — better confirmation, worse price.
You wait. After the 3rd drive forms, you watch for a market structure break.
Then you enter on the first lower high (bearish reversal) or higher low (bullish reversal) that confirms the structure flip.
You give up entry price for confidence.
Both work. Neither is wrong. Choose based on your style and what your stop tolerance allows.
The bottom line.
3 Drives is powerful when all the components line up.
Structure, time, Fibonacci, level, momentum. Stack the confluence.
Be patient. Be selective.
Don't force the pattern on every chart — it doesn't show up that often when all the rules are met.
One clean 3-Drives setup is worth ten guesses.
Trade what's in front of you. Not what you wish was there.
WOO X Pro — zero fees on spot: https://t.co/iWxTrgYsA3
FVG: The One Filter That Actually Matters. CHEAT SHEET
You voted for this one. Here's the part that isn't the textbook version.
Quick definition first. A fair value gap is an imbalance left behind by a big impulsive candle, a move so fast that buyers and sellers didn't fully trade with each other at every price level in between. That empty space is the gap. Price tends to come back and revisit it later to fill the orders that never got matched the first time. That's the "why" behind every FVG you see.
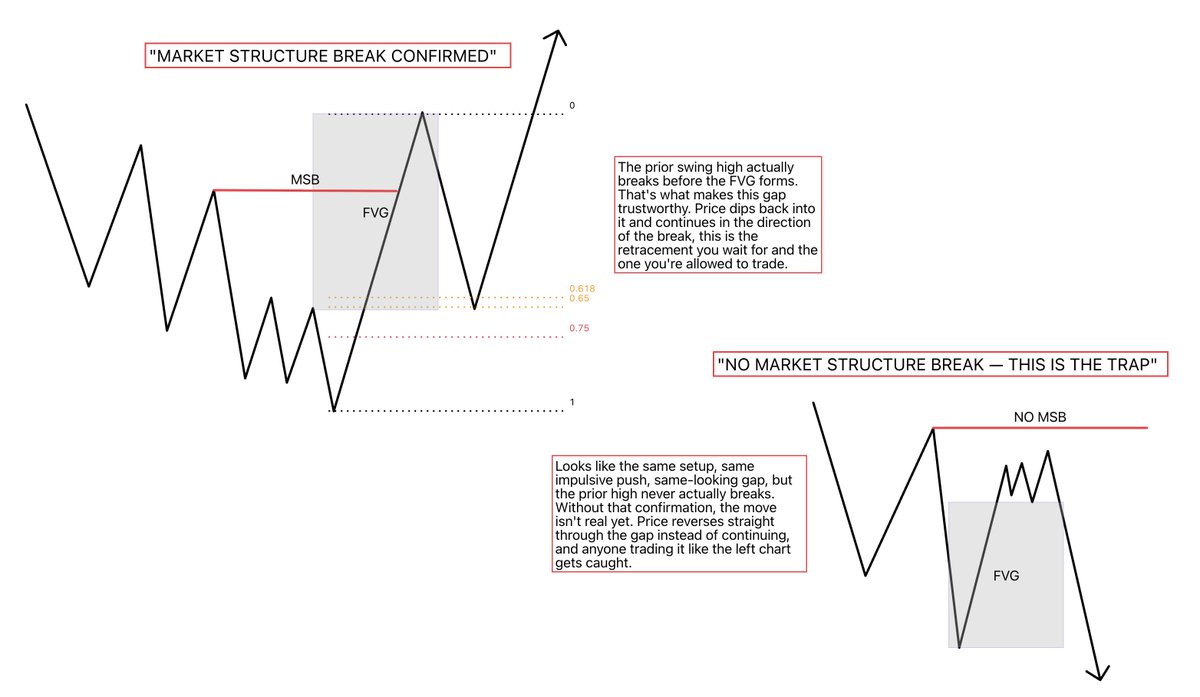
But not every fair value gap is worth trading. The filter is whether the move that created it actually broke market structure.
FVG with a confirmed Market Structure Break, that's the one you trust. The prior swing high actually breaks before the gap even forms. Price dips back into it and continues in the direction of the break. Here the FVG is your entry, you wait for the retracement into the gap and take it there.
FVG with no MSB, same-looking impulsive push, same-looking gap, but the prior high never actually breaks. Without that confirmation, the move isn't real yet, it's a trap. Price reverses straight through the gap instead of continuing. Here the FVG isn't your entry, it's your target, you'd already be positioned against the failed high, and the gap is the level you're expecting price to fall through.
Same shape on the chart, two completely different jobs. One tells you where to get in. The other tells you where you're going. The MSB is what tells you which one you're looking at.
One more thing nobody tells you: never place your actual entry in the middle of the gap itself. No support or resistance lives there, it's the most violent part of the move. Enter at the origin instead, invalidation at the structural high or low, not mid-gap.
Pop
⭕️FULL EDUCATIONAL ARCHIVE⭕️
This is the complete "archive" of all the most important educational post I created during these years.
Hours and hours of intense work condensed into 1 single post, so you'll be able to study this free material that I think will truly take you to the next level.
1. Liquidity related technical concepts:
https://t.co/awvo0Jij2Z
2. Way of charting from scratch:
https://t.co/rZjUQkHmyq
3. The importance of candle closures:
https://t.co/55nKllggiA
4. The importance of candle closures pt.2:
https://t.co/AuVRC2SZR1
5. The truth behind supply & demand levels:
https://t.co/4IvnCjXu8c
6. Fibonacci reverse sequence:
https://t.co/rc3V0SVWNx
7. Fibonacci extensions in play:
https://t.co/VV9SKGY4Rt
8. Setting targets based on data:
https://t.co/Qdv2qRXoSo
9. The truth behind fundamentals: (in crypto)
https://t.co/MHXq4E8b0r
10. How influencers scam you:
https://t.co/fKPvjg5MDY
11. How influencers scam you pt.2:
https://t.co/bxg1Oqj3TP
12. Reprogramming your mind for taking profits:
https://t.co/KPQYryk9uO
13. Order blocks guide:
https://t.co/UG2DW1CCb7
14. HTF distribution in play (no fundamentals):
https://t.co/imXMYSG81Q
15. Fair Value Gaps:
https://t.co/xByxZYQgLS
16. Distribution at Fair Value Gap:
https://t.co/64rUPPvkB9
17. Fibonacci insights:
https://t.co/D5DO1qiosi
18. Fibonacci settings:
https://t.co/74piO8akuX
19. Compound game:
https://t.co/aHc0xSl6fJ
20. Taking profits & strategies:
https://t.co/gQ4lL2oCNI
21. The game of inefficiency, liquidity and orders:
https://t.co/UjA2o3Wqyb
22. Backtesting a strategy:
https://t.co/jTZhPFsQ8t
23. The quintessential mental model of a real trader:
https://t.co/l95ZyGdT4E
24. Using volume areas to form a bias + repricing and migration of value + using defensive levels to place the stop + execution of a MTF long inside an HTF range:
https://t.co/Cqsl1AV5c7
25. Value migration theory + understanding market's behavior and placing trades + protection levels:
https://t.co/QplrrYYJIa
26. AMT full framework:
https://t.co/D9GLAYjotw
27. Understanding capital rotation:
https://t.co/vdVBGJRNFA
28. Intermarket analysis:
https://t.co/6V9m7XxvBK
29. Intermarket cheat sheet:
https://t.co/8i7troUv8O
30. How to form a bias with intermarket analysis + spotting opportunties + capital rotation + alpha & beta plays:
https://t.co/H3XYoyfufC
31. Continuation of the post above:
https://t.co/9SOKmXpV2f
32. Qualifying ranges + VP:
https://t.co/UiBAtEtG03
33. Scalp on NYO to understand liquidity dynamics:
https://t.co/p64f25cV1K
34. Scalp on NYO & explanation:
https://t.co/NN5nij99Ye
35. 9-steps psychological framework to not sabotage yourself:
https://t.co/al5I7prhLw
36. VSA analysis HTF example:
https://t.co/RPIXwszGcy
37. VSA pt. 2:
https://t.co/5Bv0ERtGk8
38. Qualifying supply & demand based on MA:
https://t.co/ssdBnWaXPZ
39. Orders absorption at levels:
https://t.co/l7FHMQNVxQ
40. The importance of trading less assets + TAO example:
https://t.co/uNGBSK11fc
41. Mini price action + volume live mastercalss:
https://t.co/ZLTA9UPAqI
42. Isolating price action with FRVP:
https://t.co/n7gG5YevV2
43. Price discovery methodology:
https://t.co/InsBQs705v
44. Failed Auction:
https://t.co/mXBBiCGzJ1
45. How to survive to an economic downturn:
https://t.co/5jBLYXnjyX
❗️Educational video explaining: ❗️
- Value migration theory
- Using value for understanding market's behavior and placing trades
- Exploiting value areas as dynamic protection levels
This video will help you to comprehend market dynamics on a deeper yet simple level.
Watch, implement and share if you think it can be valuable.
Educational video explaining:
- How to use volume areas to form a bias
- Repricing/migration of value
- Using defensive levels to place the stop
- Execution of a MTF long inside the HTF range
Watch, implement and share if you think it can be valuable.
“Mate, how do you actually use Volume profile or AMT when looking at a chart? Anything more I can learn?"
Ok guys, let's drop the whole framework with the hope that you may find interesting ideas to apply to your journey/trading. (❗️Brutal value below❗️)
Disclaimer: As always, everyone has a different style and the goal is not copying someone else's strategy but building a process that provides statistical advantage over time (after backtesting).
What works for me might not work for you depending on timeframe, goals and availability.
(Quite long post, if you're lazy skip it (but don't expect results/improvments)
🔸 1st step -> Understanding what Volume Profile actually represents.
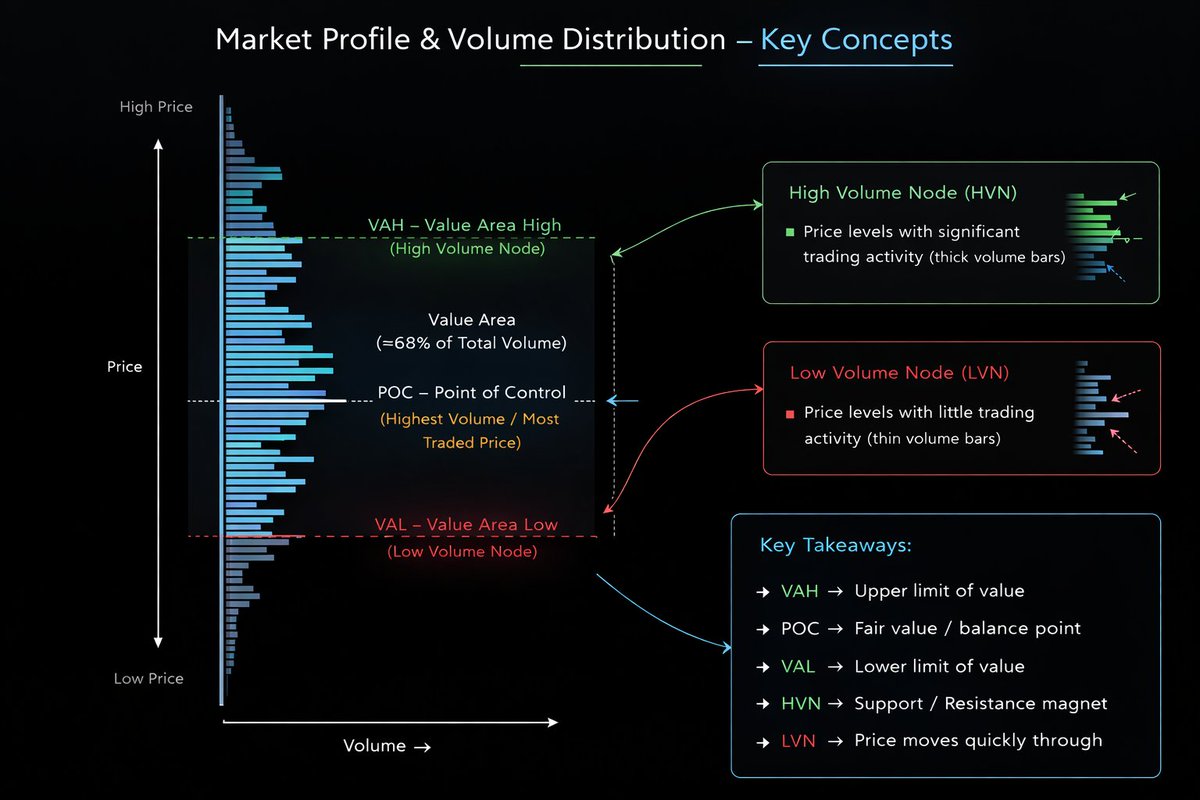
Volume Profile is simply the distribution of traded volume across price levels, not across time like traditional volume bars.
This allows you to see where the market actually accepted value and where it rejected it.
From a basic perspective, there are 3 important elements:
• POC (Point of Control) → the price with the most traded volume
• Value Area (VA) → where roughly 68/70% of the trading activity occurred (divided into VAH and VAL)
• High Volume Nodes (HVNs) → areas of acceptance
• Low Volume Nodes (LVNs) → areas of rejection or inefficiency
HVNs act like magnets for price because they represent equilibrium where buyers and sellers previously agreed on value.
I like to think, instead, about LVNs as "highways" where price tends to move quickly due to the lack of prior transactions.
Already here you can start understanding why the market often accelerates through certain areas and slows down around others.
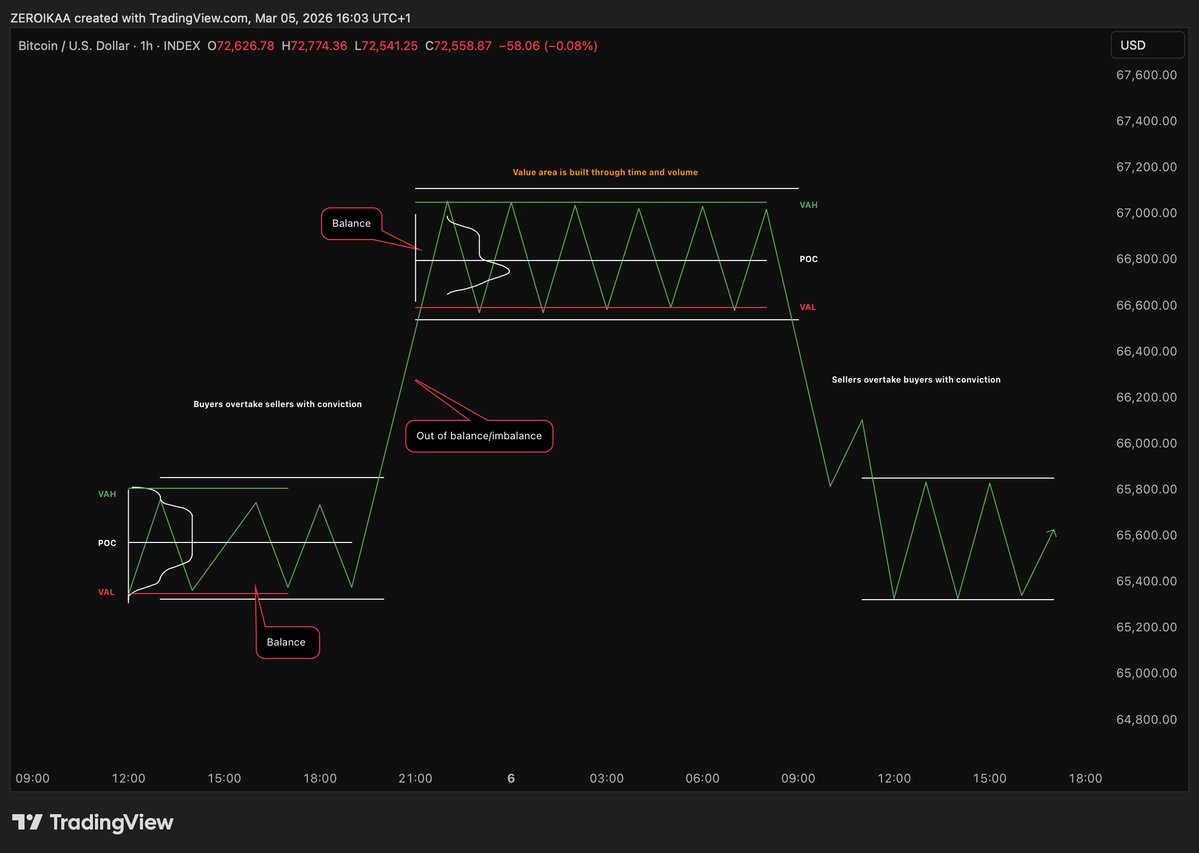
🔸2nd step -> Auction Market Theory
Markets are basically continuous auctions between buyers and sellers.
The market constantly asks a question:
“Is this price fair?”
- If participants accept the price → the market builds value.
- If participants reject the price → the market moves to find a new fair value.
This creates 2 fundamental environments:
- Balance (equilibrium)
Price rotates inside value areas and HVNs.
- Imbalance (discovery)
Price leaves value and searches for a new fair value.
Recognizing when the market is balancing vs discovering is one of the most simple yet powerful concepts in trading.
If the market is balanced → expect rotations.
If the market is imbalanced → expect continuation.
🔸 3rd step -> reading the shape of the profile
This is something that usually gets unnoticed.
Volume profiles often form recognizable structures:
• D-shaped profile → balanced market, rotation
• P-shaped profile → short covering -> bullish continuation
• b-shaped profile → long liquidation -> bearish continuation
• Double distribution → market transitioning between 2 value areas
The shape of the volume tells you what's happening in the auction.
"Eh? What do you mean?"
For example:
A P-shaped profile has higher probability of appearing after aggressive short liquidations where the market rallies and then builds value at the top -> based on context it's a bullish sign -> why? -> If the market holds the upper value area, it suggests that after shorts were squeezed, new buyers are accepting higher prices.
A b-shaped profile usually appears after longs get trapped and forced to exit -> based on context it's a bearish sign -< why? -> If the market accepts lower prices after the liquidation, it suggests new sellers are active, not just liquidation.
These structures help you understand who is trapped and where liquidity might sit, forming a bias.
🔸4th step -> Identifying volume voids
One of the most powerful concepts is the Volume Void.
These are areas where very little volume was traded.
Because the market previously rejected those prices quickly, when price re-enters these zones it often moves very fast.
You will see tht volume voids frequently align with:
• FVGs
• Impulsive candles
• Liquidity sweeps
When multiple inefficiencies overlap, the probability of fast price movement increases significantly, so you can use them to your own advantage.
🔸 5th step -> Value migration
Another key AMT concept is observing how value shifts over time.
- If the POC and value area move higher, the market is accepting higher prices → bullish context.
- If value migrates lower, the market is accepting lower prices → bearish context.
In this GBP/USD example I made you can clearly see the migration of value + the concepts explained.
However, in my experience the real edge comes when price moves away from value too aggressively.
Markets tend to revisit previous value areas because auctions like to rebalance unfinished business.
That's why many large moves eventually retrace toward prior POCs or HVNs.
🔸Sixth step -> Combining VP with price action
Volume Profile alone is not enough, nor it will ever be.
It becomes powerful when combined with:
• S&D zones
• Liquidity pools
• MS (HH/HL or LH/LL)
• FVGs or inefficiencies
Example:
Price sweeps liquidity above a swing high → enters a LVN → rejects from a HTF supply zone.
That confluence creates a much stronger trade idea than using any single tool, in my experience.
The profile simply provides context about where the auction is strong or weak.
🔸 Seventh step -> Execution
The most important step, isn't it?
Once the levels are mapped, I usually monitor:
• Reactions at HVNs or POCs
• Fast moves through LVNs
• Acceptance or rejection outside value areas
• Value area shifts
- If price re-enters value after a breakout, there's a high probability of a rotation across the value area.
- If price accepts above or below value, the market has a higher probability for starting a new auction.
Based on this I plan my longs and my shorts but also (and that's probably the most important part) I adjust the stop loss in a dynamic manner, meaning that I wait for the price to test and to be rejected from a value area before moving my stop depending on my bias (long🔼 or short 🔽)
That’s basically the framework I use when incorporating Volume Profile and AMT into my analysis.
It's pretty much logical that you need time to assimilate these concepts, but to me and for my style they're the best I can use, so I highly encourage you to study them.
They don't replace price action, but they reveal the structure of the auction behind it, which is 🔑
As always, if you found this helpful, the like and repost buttons are just a few centimeters below.