@wailsworkshop The focus of this year’s call is on AI & Education Responsibly and Inclusively, with particular attention to awareness, risks, and meaningful use of AI by both students and educators.
We’re excited to launch the 3rd edition of WAILS (Workshop on AI & Learning Sciences), taking place in Paris this December! 🇫🇷
📢 The Call for Papers is now open
📄 Submit your work: https://t.co/wVxNuZJAlG
#WAILS2026#AIinEducation#ResponsibleAI
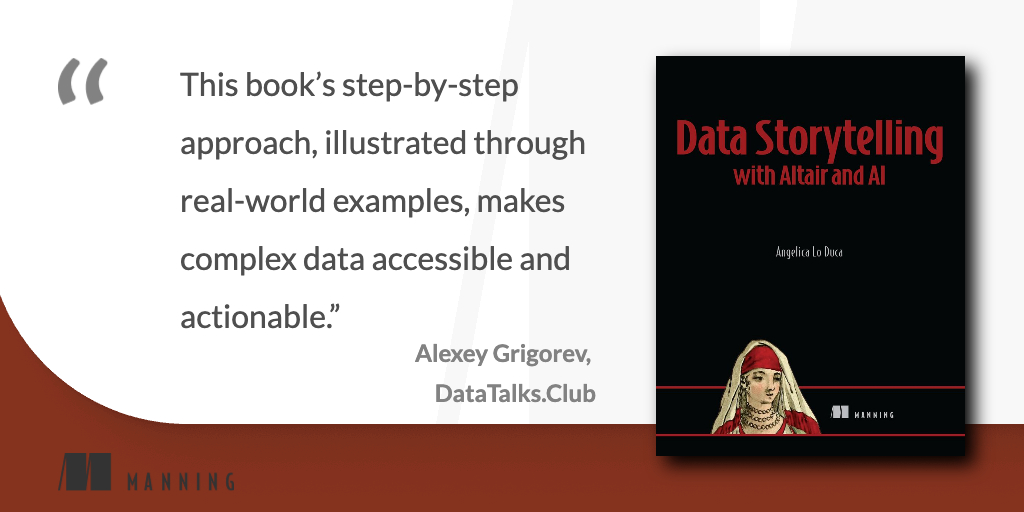
Now available for ACM Members: "Data Storytelling with Altair and AI" audiobook by @alod83. A stack of tools/ tried-and-tested methodologies that will rapidly increase your productivity, streamline the visualization process, & leave your audience inspired. https://t.co/WFOtn0xf15
"Conflict, Montage, and AI in Data Storytelling," by @alod83 (@CNRsocial_), further explores the use of cinematic techniques and AI in data #storytelling. https://t.co/amMxKo5LZQ
VIDEO ALERT!
Curious to see what's inside Data Storytelling with Altair and AI by @alod83? Check out the video below for a sneak peek at the book's first chapter: https://t.co/OtvjAMsfoJ
#Dataviz#Altair#AI#manningBooks
Don't forget!
@alod83 is going live in just an hour to share techniques that will help you bring creativity and authenticity to your datasets!
Tune in: https://t.co/ZthYoUsaFk
Don't miss the latest on @BrightTALK!
@alod83, Data Storytelling with Altair and AI author, will share tips on turning data into stories tomorrow, 1/28, at 7am EST.
Catch the event here: https://t.co/ZthYoUsaFk
Get 45% off her book w/ code BTloduca here: https://t.co/Sv1i6OYPKi
Data Storytelling with #Altair and AI
What is it? A book with principles, techniques, examples, and exercises to integrate #DataStorytelling and #AI using Python Altair.
Who is it for? For all #Python developers and data scientists
https://t.co/0I362IbPUb
📊 When creating a chart, where should you place your data source credits? Check out @alod83's article for 4 effective strategies to enhance your credibility and storytelling.
#Data#DataScience#Chart
https://t.co/yTNZHNjORi
When using external data in a chart, always cite the source to credit the original work and boost your credibility. Citing makes your chart more authoritative with verifiable data.
Full article: https://t.co/7XLDHTqTrK
#Data#DataVisualization#ChartDesign#DataStorytelling
📣 Now available in print! 📣
Data Storytelling with Altair and AI, by @alod83
https://t.co/r5sFGbNsAl
📚 Learn how to organize, visualize, and present data using #Python, #genAI, and the #Altair data visualization toolkit. 📚
#DataViz#ManningBooks#LearnwithManning
Can infotainment and data storytelling be combined? 📊🎬
Discover intriguing insights from Angelica Lo Duca @alod83, author of "Data Storytelling with Generative AI," in this must read article.
🗞️🔗 https://t.co/v2sTVGxnww
#DataStorytelling#GenerativeAI#Data#ManningBooks
Using a real-world dataset as an example, @alod83 shows how you can tweak your data visualizations to ensure they fit the needs of specific target audiences — in this case, professional, non-technical stakeholders. https://t.co/zEkW8N0uay