@MickeyCapStocks Hey! Primarily TradeZero as the locates are generally reliable, and for capacity, I actually did and found the number to be ~$95k for one of the intraday based short strategies:
https://t.co/YTp57NE9cG
I am literally giving short sellers the answers to tomorrow's test here.
I pulled every negative stock catalyst over the past 3 months and tracked what they did 30 days after they were first public through our datasets
- Toxic PIPEs -> -20%, 88% of the time
- De-SPACs -> -35%, 86% of the time
- Reverse Splits -> -28%, 77% of the time
And the list goes on, and on, and on
You can literally short anyone out of the hat and still make money
Borrow rates for most are more than manageable as many are serial diluters, so there's nothing stopping you
@dmartin_trading It's a commendable effort, but you can really only squeeze so much out of just raw OHLC data. Try putting your same effort for a month but just pointed at alt data feeds, it'll be a bump up in sophistication and you'll see much more real, tradeable alphas
2020 through 2025: half of all corporate default 8-Ks came from a company that had already filed one.
508 events, 350 tickers.
-> 96 of those tickers filed more than once
-> they account for 254 of the 508 events
one ticker filed 9 times.
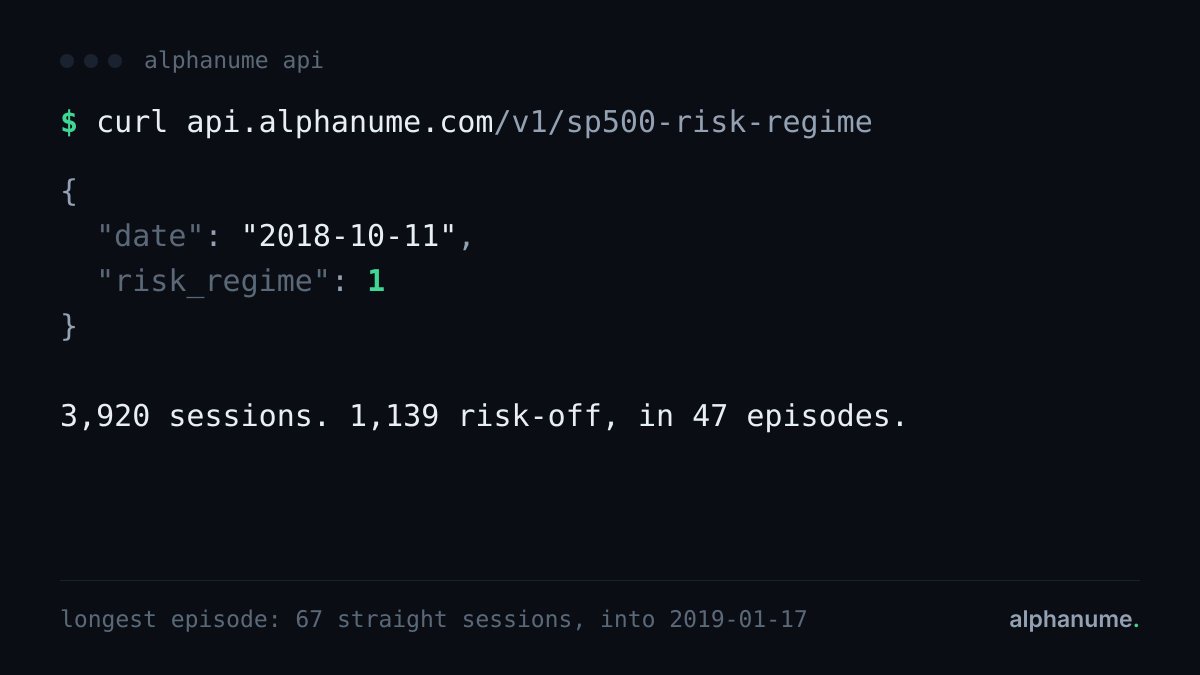
1,139 of 3,920 s&p sessions since march 2011 were risk-off, in only 47 separate episodes.
the flag is not a daily coin flip.
the ten longest hold 467 of those sessions. longest: 67 straight, into january 2019.
two columns, one bit a day. this is PUBLIC.
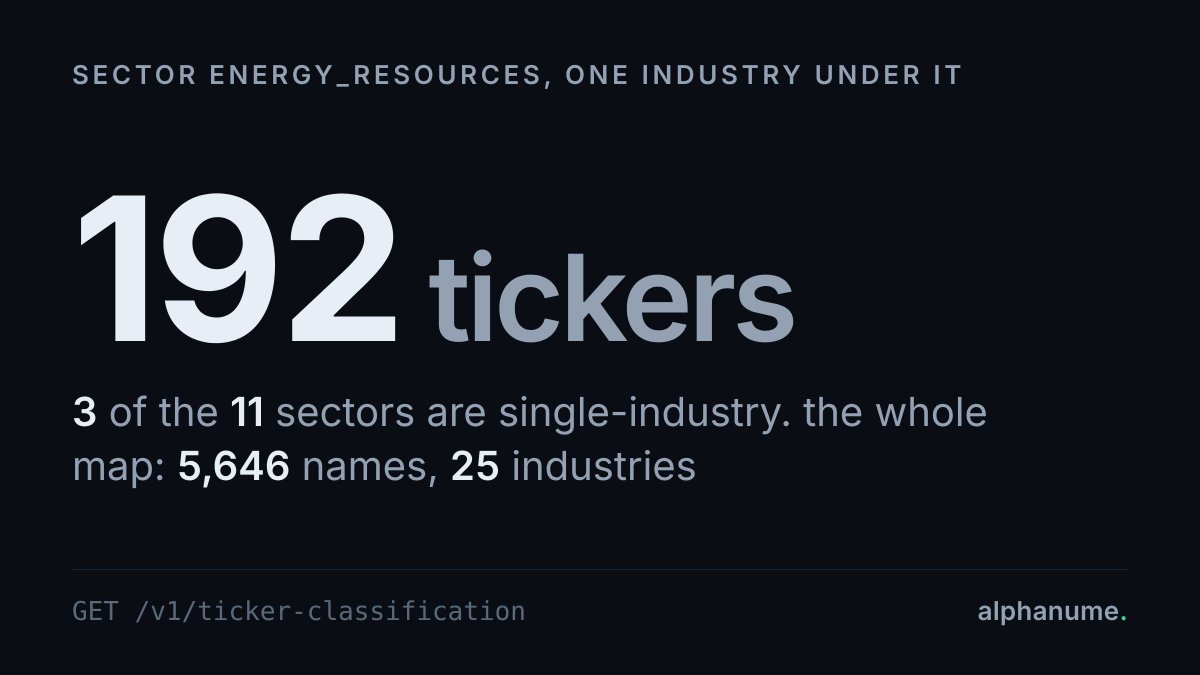
192 tickers carry the energy_resources tag. that sector resolves to exactly one industry.
whatever moved the complex monday, the screen is one filter deep.
3 of the 11 sectors are single-industry. energy is the second largest.
5,646 names in the map. the join key is free.
ask your agent "which sponsor has closed the most de-SPACs"
-> get_de_spac_events
-> one row per merger, redemptions and trust remaining
-> 743 deals on file, 408 of them closed
asked november 2: 330 distinct sponsors across 332 closings. two did it twice.
8 of the last 21 daily slates carried AAOI, an optical name.
7 landed before monday's interconnect merger.
its biggest scored moves in that window: 12.78%, 7.75%, 6.83%.
five names a session, outcomes written back after the close.
100 scored picks averaged 5.96%.
one name's 21-day implied-vol standard deviation ran 78% of its own mean on october 30.
the median name across 529: 9%.
ABR, 8.8 sigma clear of the cross-section.
single-name vol-of-vol, ranked every session. this is PUBLIC.
your agent can now ask which companies got loud on EDGAR, in one call.
-> get_filing_intensity(filing_count_gte=5)
-> every covered ticker, every day, zeros included
-> october: 903 ticker-days over five filings, 579 names
asked november 1: JPM filed 261 times on october 2.
ask your agent "did the beat even matter"
-> get_earnings_move_history
-> the eps estimate, the actual, the implied move, what the stock did
asked november 1: 94 of october's 112 prints beat. 40 of those closed lower.
FTNT beat and fell 20.09% against an 11.87% implied move.
296 of 539 optionable names had implied vol below their own realized vol on october 30.
median iv/hv ratio: 0.95.
-> 18 names at 2x or richer
-> XP: 0.44 implied against 2.64 realized
-> UPXI the other way: 5.51
the premium is not something the whole tape carries at once.
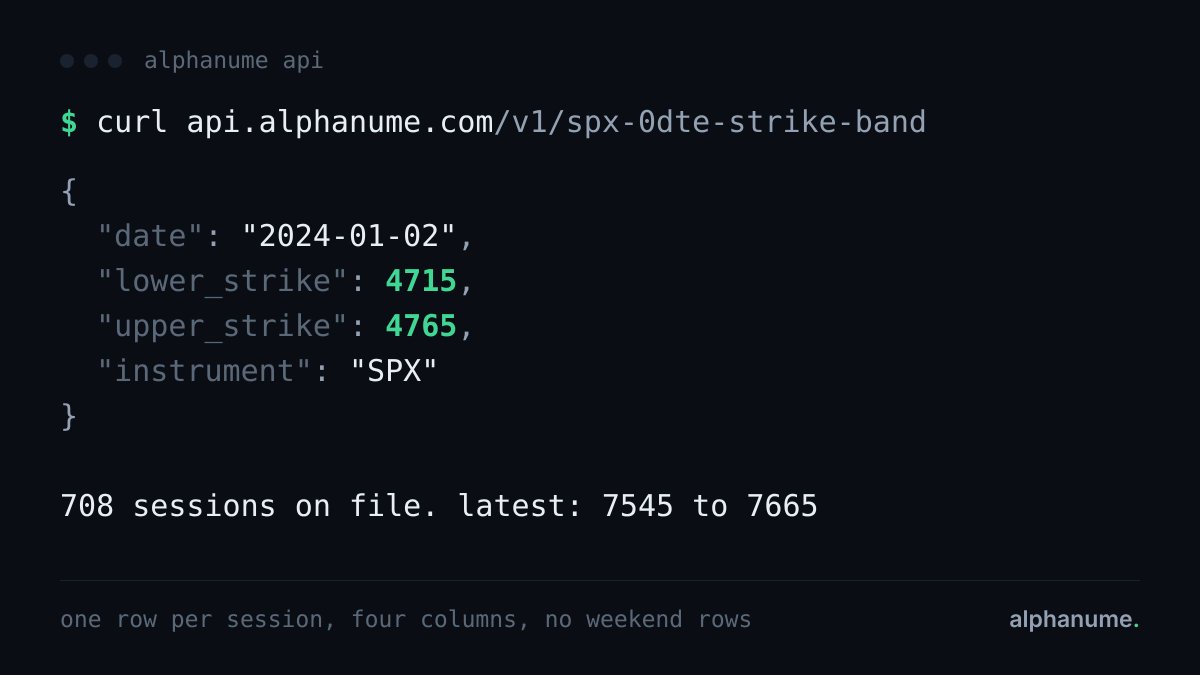
the SPX 0DTE expected-move archive opens at 4715 to 4765. the latest row: 7545 to 7665.
708 sessions in between, one row each, four columns, zero weekend rows.
every edge sits on the 5-point grid. no close, no outcome.
this is PUBLIC
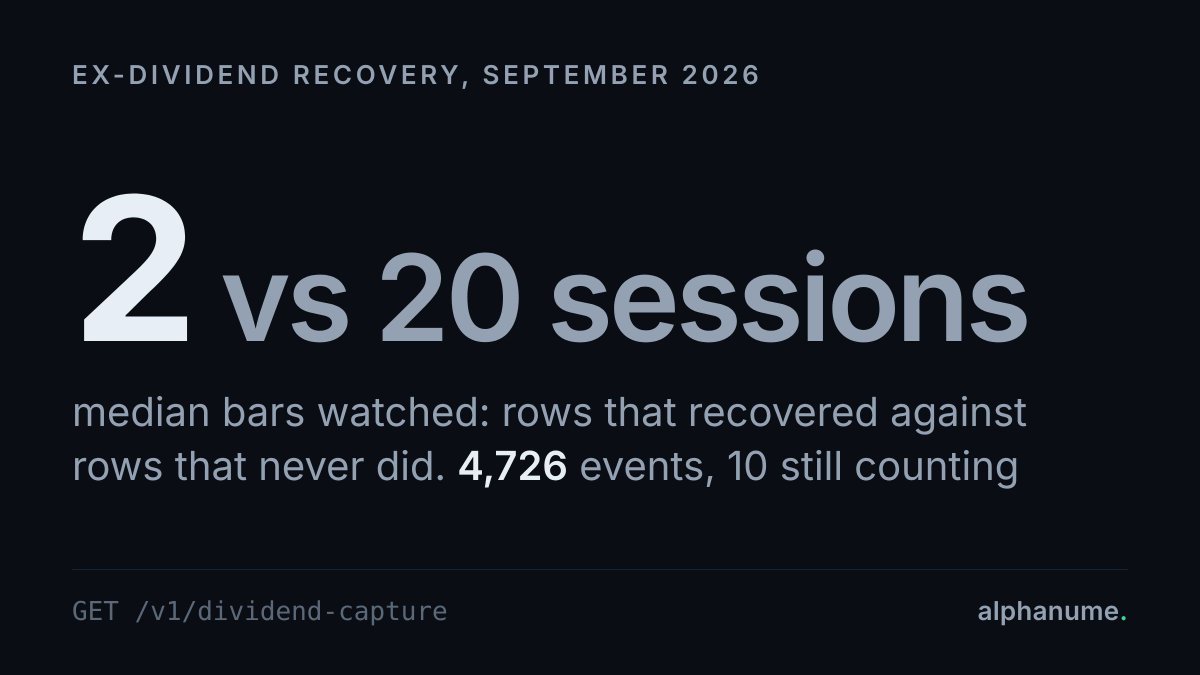
september's 4,726 ex-div events: 3,577 recovered, 956 not, 10 still counting.
the recovery flags are counted sessions, not an estimate.
-> the recovered rows watched a median of 2 sessions
-> the ones that never got back watched all 20
39% were even in one.
SPWR filed seven S-1 registrations in 2026. market cap at the first: $174M. at the seventh: $85M.
386 S-1s across 272 tickers this year. 23 names came back three times or more.
machine-read, sized in shares, stamped with the cap at filing. it's PUBLIC
268 of 469 optionable names closed october 30 with implied vol above their own one-year median.
realized vol cleared its own median in 218.
-> both: 144
-> neither: 127
median iv rank 43.5. median hv rank 34.
every name scored against its own year, not the index's.
309 three-sigma wikipedia attention spikes in october. 193 names behind them.
80 of those tickers tripped it more than once.
PINS five times, four sessions running.
EA printed 132.27 sigma on october 21, on 18,657 reads.
one parameter: zscore_30d_gte=3. it's PUBLIC
ask your agent "which is bigger, AMD or ORCL, and when did that change"
-> get_historical_market_cap(ticker="AMD")
-> daily market cap and shares outstanding, one row per session
asked oct 30: AMD $824B, ORCL $395B.
they traded places 3 times. the last one was april 24.
ask your agent "what share of march 2026 was risk-off"
-> get_sp500_risk_regime()
-> one row per session since 2011-03-30, 2 columns
asked oct 30: 22 of 22 sessions. the whole month.
october 2026: 0 of 22. same flag, same call.