Choosing the right statistical test can be tricky.
Some tests seem ideal but don’t fit all data types.
You don't have to worry anymore.
just use this chart to guide you: 🔽
1/n: DSS is meant for complete beginners, regardless of whether they are in high school, in graduate school, or out of school altogether. #rstats#surveys#prediction#causality
Want to see for yourself? The first chapter is free here: https://t.co/SCVnlZfe4r
Book outline:
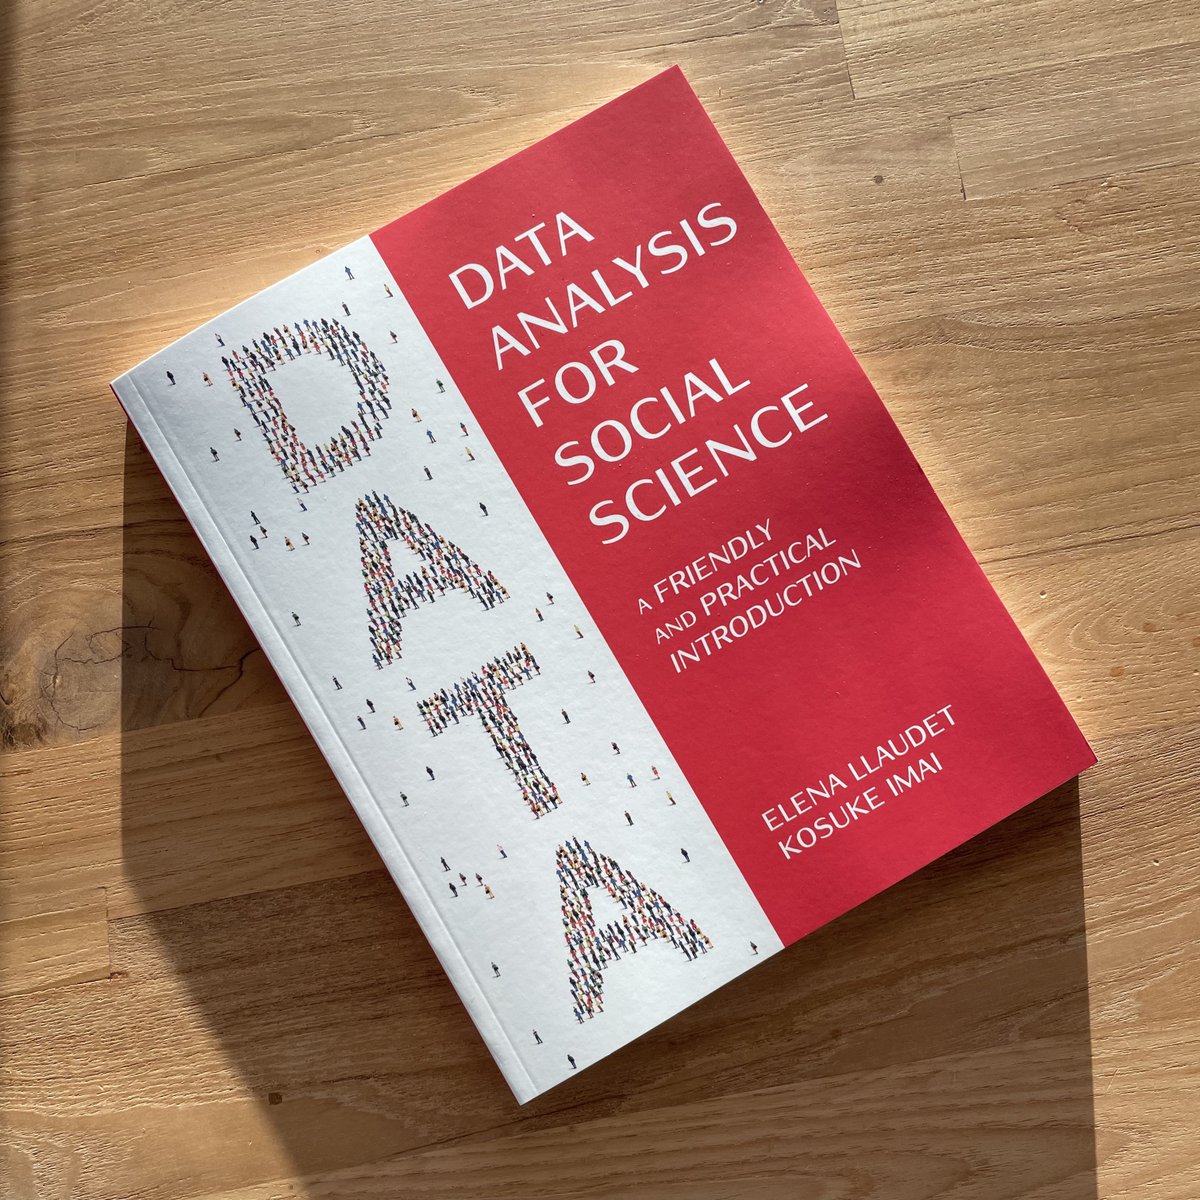
My textbook with Kosuke Imai (@Harvard) is finally out!
Assuming no prior knowledge of statistics or coding and only minimal knowledge of math, DSS teaches the fundamentals of survey research, predictive models, and causal inference + how to analyze real-world data with R.
🧵..
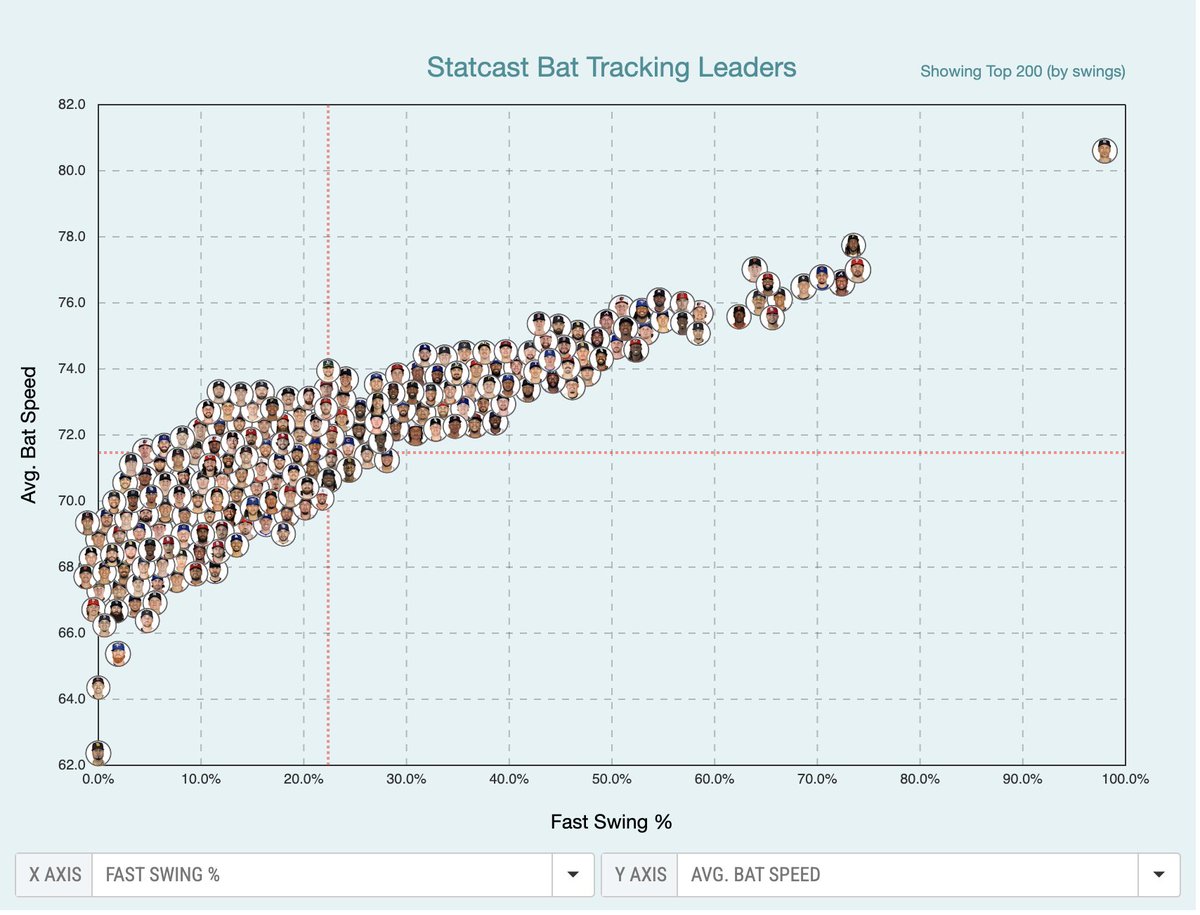
I care about this because I’m inclined to believe this is an exclusively descriptive stat, like how Statcast data should be used. Not predictive. That’s huge with me.
As noted in replies—Ohtani doesn’t rank here. Always a good reminder one stat never answers all questions. Ever.
It might be interesting to measure swing speed variation, or swing speed variation when making contact. There might be hitters who use a "contact" approach sometimes and a "let 'er rip" approach sometimes.
A quarter of the season done, and the Red Sox lead the league in ERA. If that holds up, it would be the first time that has happened since two years before the Magna Carta was signed.
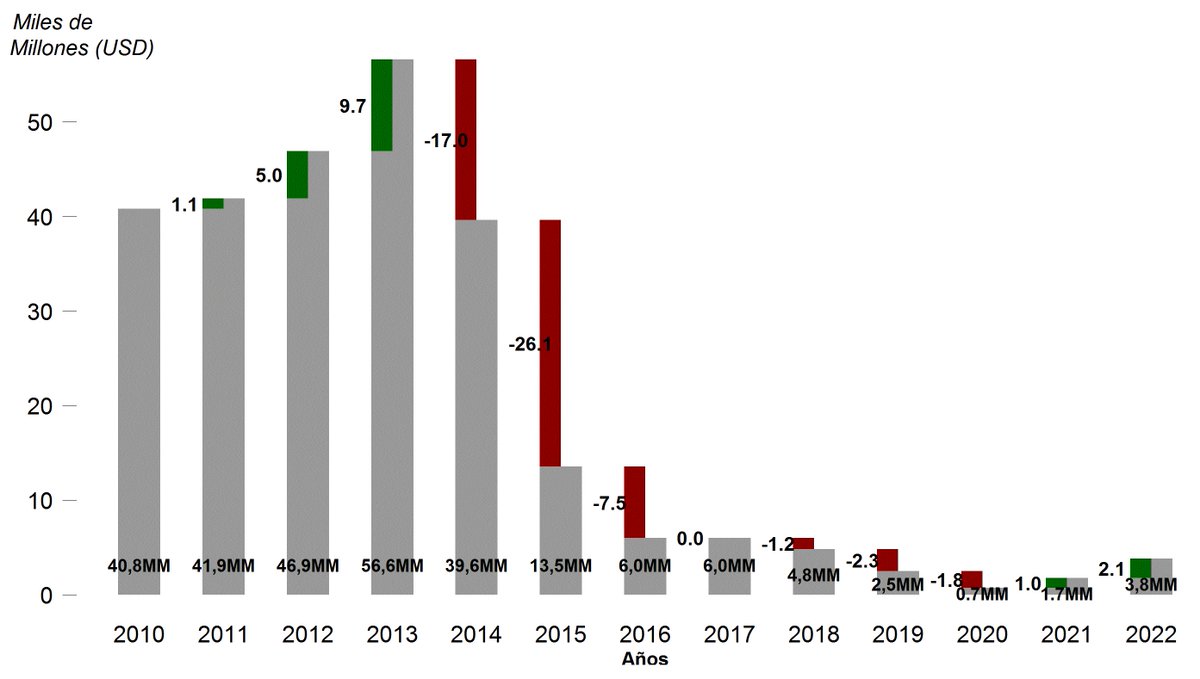
This is a figure that shows rises and falls in an original way. The focus of this figure’s message is the change. Again, following examples from Data Visualization with R by Thomas Rahlf #Rstats#socialsciences#DataVisualization
Graph (bar color: "steelblue"): Energies used in electricity production (worldwide) 2014.
Percentage(%)
Types of energy: Bioenergy / Wind / Geothermal and others / Hydro / Non-renewable / Solar PV
#Rstats & #dplyr & #ggplot2 for #socialsciencies#renewableenergy#renewables
In this area graph: World primary energy supply 1970 - 2014
Kilotons of oil equivalent (Ktoe)
Sources: Coal and oil shale / Crude oil and LPG / Natural gas / Nuclear / Renewables.
#Rstats & #dplyr & #ggplot2 for #socialsciencies addressing #renewableenergy#renewables
In this bar chart: Installed energy capacity worldwide
Unit: Billions of liters / Gigawatts
Energy types: Biodiesel, Bioenergy, Wind, Ethanol, Geothermal, Hydropower, Solar PV, Solar Thermal
#Rstats & #dplyr & #ggplot2 for #socialsciencies about #renewableenergy
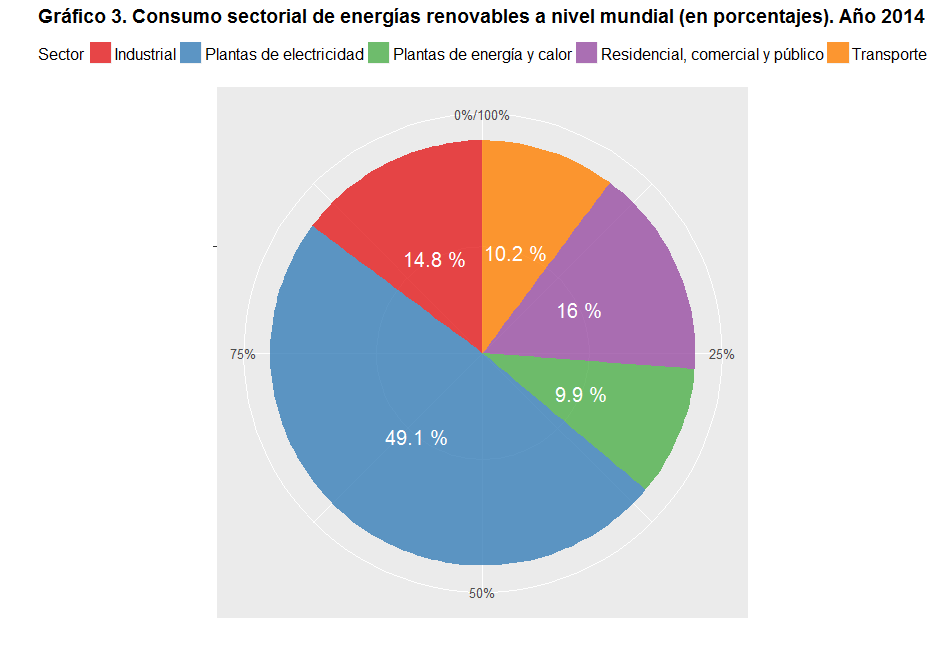
In this pie chart: Sectoral consumption of renewable energy worldwide (Percentage). Year 2014.
Sector: Industrial / Power plants / Power and heat plants / Residential, commercial and public / Transportation
#RStats#ggplot2#dplyr#renewableenergy
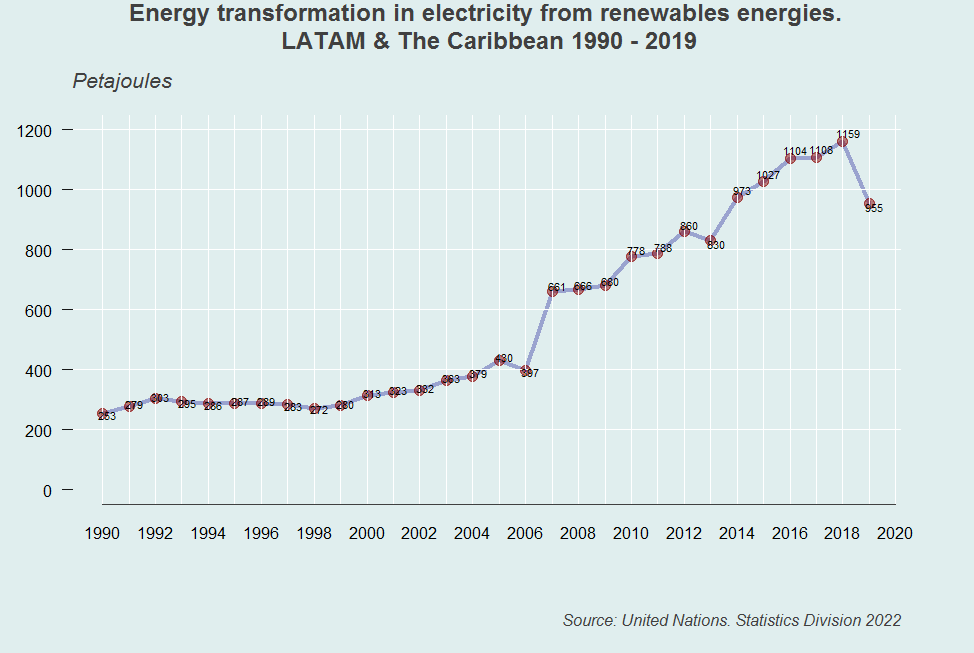
The chart was specified with the plot() function, & the type=“n” parameter to keeps it from being plotted. Then, with lines() and points() two rows later that happens. We use abline() to draw white lines for orientation in background. #Rstats#renewables#dplyr#DataScience
The top 21 largest emitter countries of CO2 - Apropos #COP27, we plotted this chart with the barp function, from Jim Lemon's plotrix package - #RStats & #DataVisualization & #Datascience