If you ever needed a clean vector map of anything, you know the pain of finding one that's in the right detail or projection. Our SVG Map Generator solved the issue, and now supports automatic, exportable labels. Check it out. #maps#dataviz#svg
https://t.co/v5EzLHlWPy
Data can be beautiful. All it takes is a bit of initiative and a spark of creativity. DataViz Dojo looks at a fascinating initiative from a national data agency in the context of the data-as-art trend.
#dataviz#art
https://t.co/6NFwgSMSGS
Solar eclipses are cool. Period. In our latest DataViz Dojo article we look at how they were used to make Einstein famous, curiousities about the phenomena, and a practical tool to track and plan ahead. #dataviz#astronomy
https://t.co/jMZYjP6mP3
In case you didn't know, there's an eclipse coming to your backyard. Here's the Solar Eclipse Map. It's a unique interactive tool that let's you visualize exact times and sun coverage at any square inch of our Planet. Try it! #dataviz#astronomy
https://t.co/lysKWj7vCH
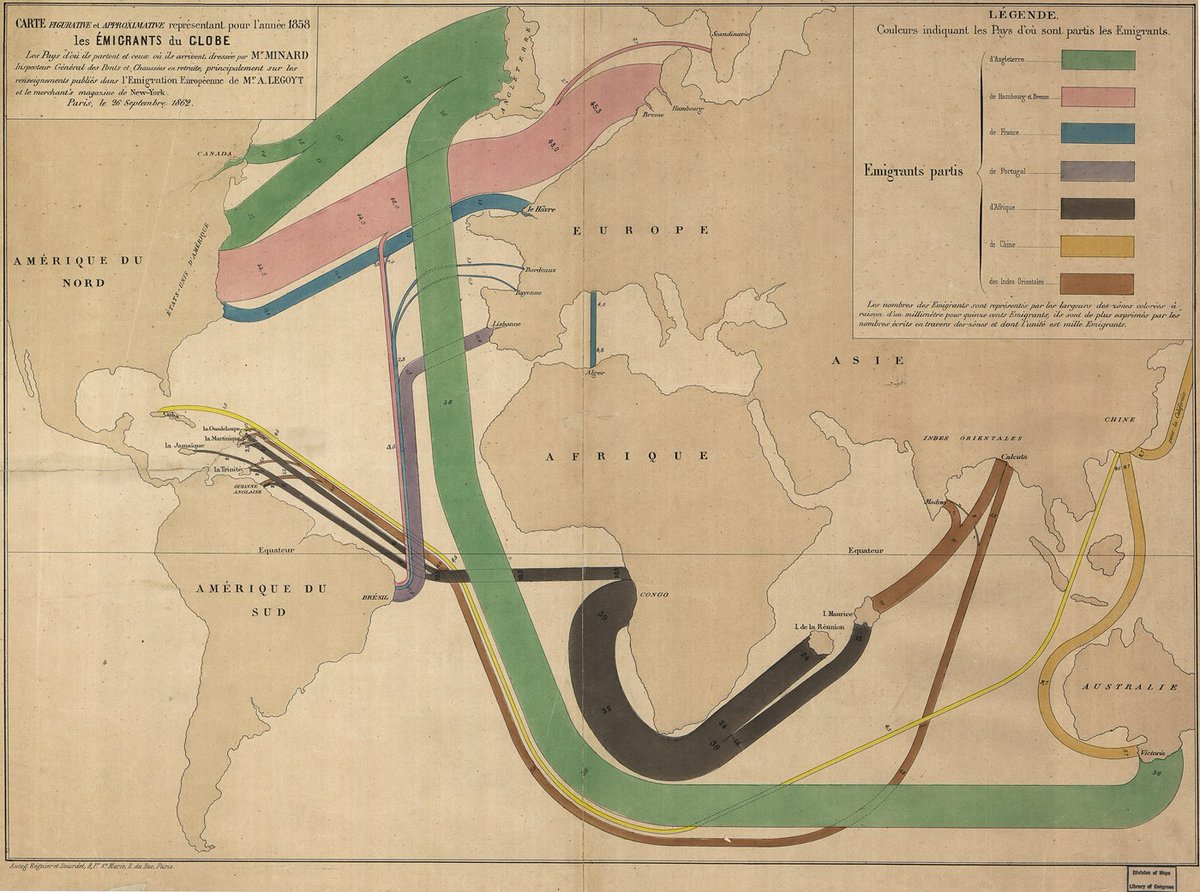
Hot on the heels of our Map Sankey release, here's a piece of fascinating history that kicked off the this type of visualizations nearly two centuries ago:
https://t.co/yzJbJBt6D0
P.S.: can you tell we have a soft spot for vintage maps?
#dataviz#maps#history#geography
Introducing Map Sankey Diagrams! Draw projected weighted lines between locations, across multiple steps and custom path. On any map. Any projection.
https://t.co/TtRVQmn3Vb
#dataviz#geography#maps
The completely revamped VisitedPlaces tool features new straightforward UI and much faster video generator. Create an interactive embeddable custom map, a video, or a static image of your travels or plans. No-signup or payment required! https://t.co/uyBeK39PT8
#dataviz#maps
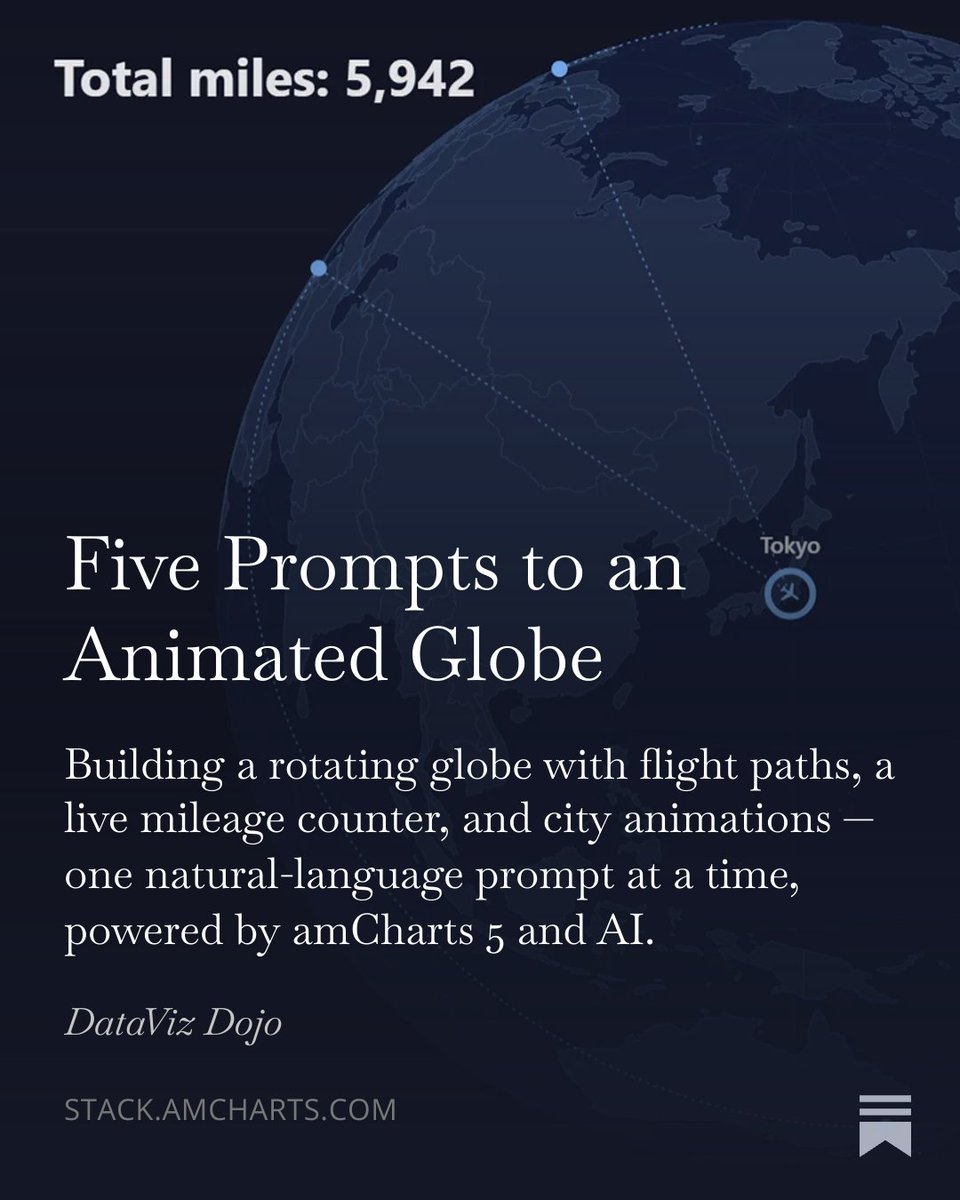
New beautifully simple DataViz Dojo article just landed: use AI and free amCharts AI tools to build a stunning rotating globe animation. #AI#dataviz
https://t.co/2HDclPSHXl
Available right now: a drop in Gantt chart library, featuring full-on editing capabilities, fast rendering, project management essentials, data serialization, and high level of customization. Try amCharts: Gantt! #dataviz#gantt#charts
https://t.co/pOxqG5Izza
Visualize trends with dynamic #Timeline#charts. @amcharts 5 adds a distinctive Timeline chart for space-efficient and visually interesting linear data representation using serpentine and spiral layouts. https://t.co/UMnfxW4sgG
Need help creating a chart? Try amCharts AI. Sketch it, upload an image, or describe the chart and watch it write the code. It will even be happy to make modifications for you. That is if you choose a personality that's not Rude McRuddison. https://t.co/ORWBihhuNq #dataviz#ai
Curved timeline charts are back! Exclusively from amCharts. Available now for amCharts 5 as Serpentine, Spiral, or any custom shape. #dataviz
https://t.co/bPomlpcjaC