Desde quando virou socialmente aceitável compartilhar vídeos de pessoas na hora da morte nessa rede? Que horror, gente. Mais respeito pelas vítimas e famílias 😕
@davidabbottbris Agree. If we want people to excel at their skills, then supporting them with a well-suited (and healthy) context for it should be a premisse. People can learn in adverse settings but this should be the exception, not the rule.
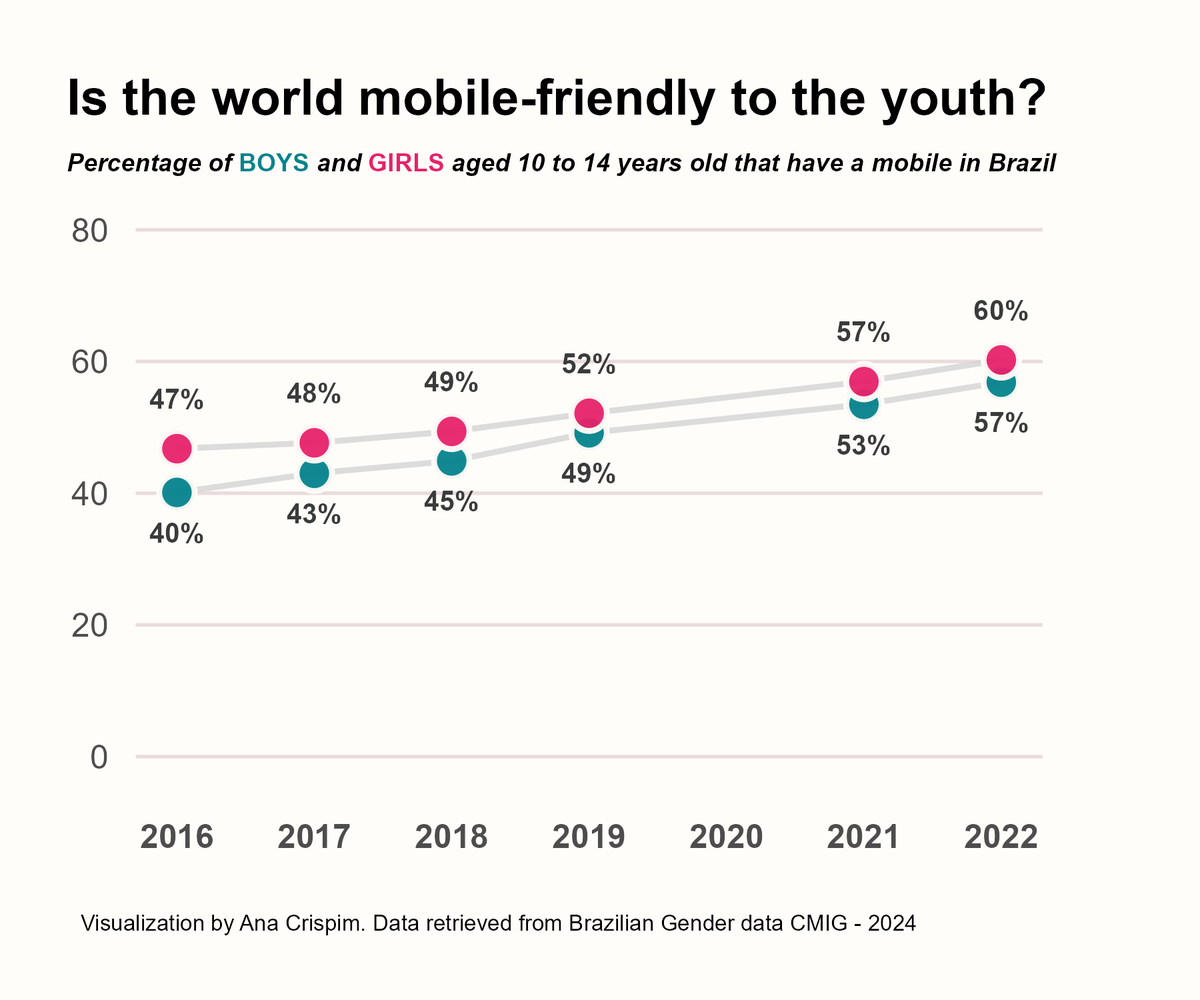
Across the years, we see an increase in the percentage of kids reporting to have phones in Brazil. And we also start to have more discussions about how new technology and social media affect these kids.
day-11: mobile-friendly @30DayChartChall
Code: https://t.co/FspeULZbVL
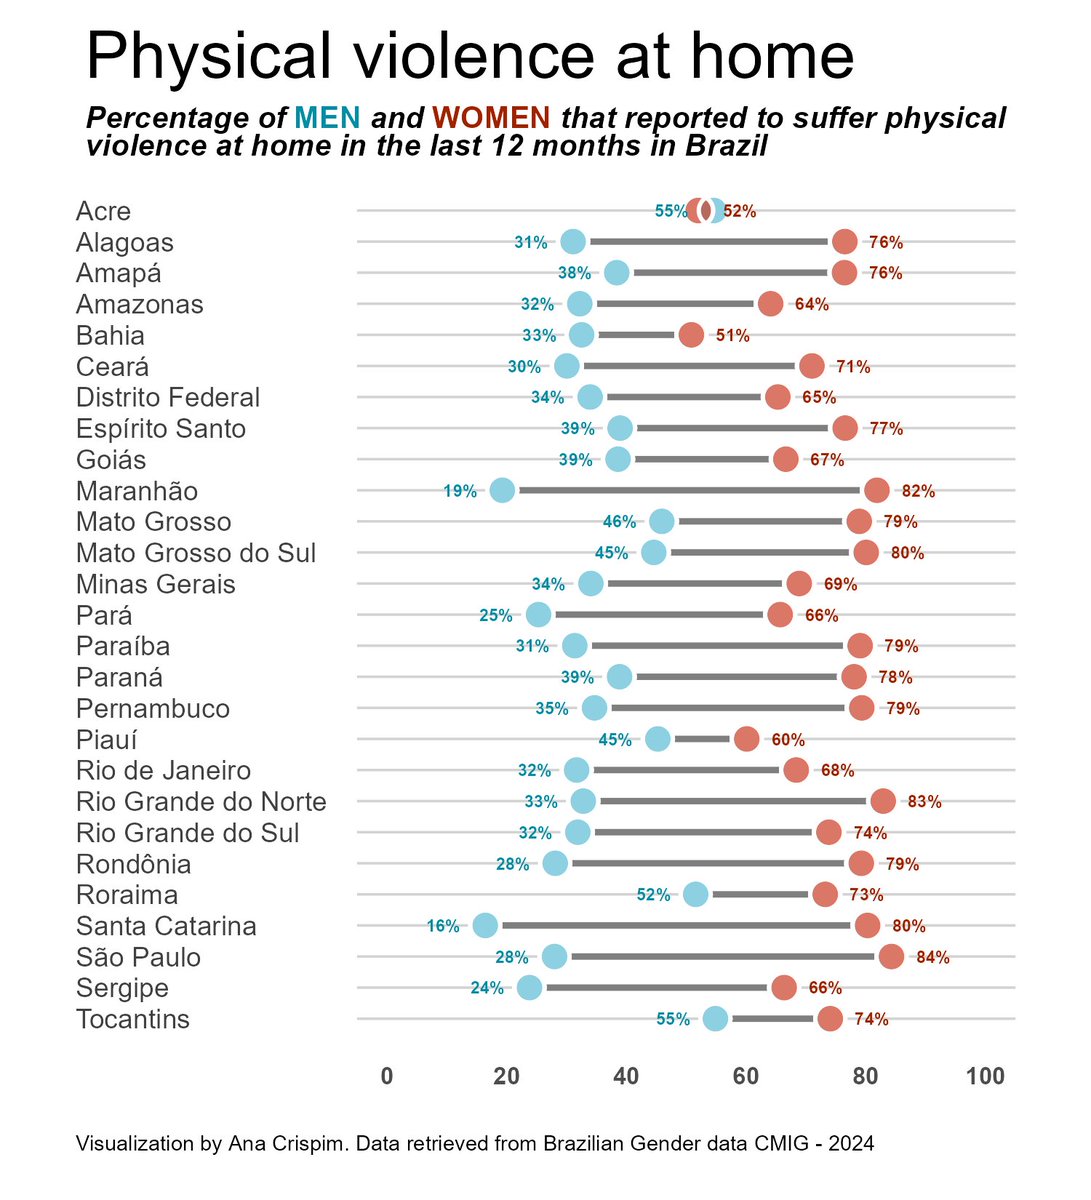
Got behind on the @30DayChartChall , but here it is my submission for day 9 (prompt major/minor): a look into how women are more vulnerable to suffer violence at home than men.
Graph inspired in a dumbbell chart by @CedScherer.
Code and credits here: https://t.co/sy5XYOFxB7
Teamed up with @giacomotg for today's @30DayChartChall to build a circular chart about how many hours men and women spend on domestic chores in Brazil. Our idea was to try to represent data clockwise.
No code for today!
Day 6 @30DayChartChall with a prompt about OECD data. Today I chose to know more about how much we are investing in education in Brazil.
Code: https://t.co/O2hSIbzzev
Day 5 of @30DayChartChall and the question to be answered is: do women and men diverge in the career choices when enrolling in college courses?
Code: https://t.co/O2hSIbzzev
Better to late than later?
Got a bit behind for day 3 of #30DayChartChallenge, but here it is my makeover: the official report showed the data comparing two years with a barplot, so I expanded it to line chart visualization with available data from the last ten years.
“Ah, eu sou autênticx”,
“Falo mesmo”
“Sou assertivx e falo na cara”
Frases que, geralmente, precedem ou sucedem alguém sendo rude e a pessoa justificando que não é rude . Grosseria é bem diferente de assertividade, viu 👍🏻.
Another day, another chart
@30DayChartChall
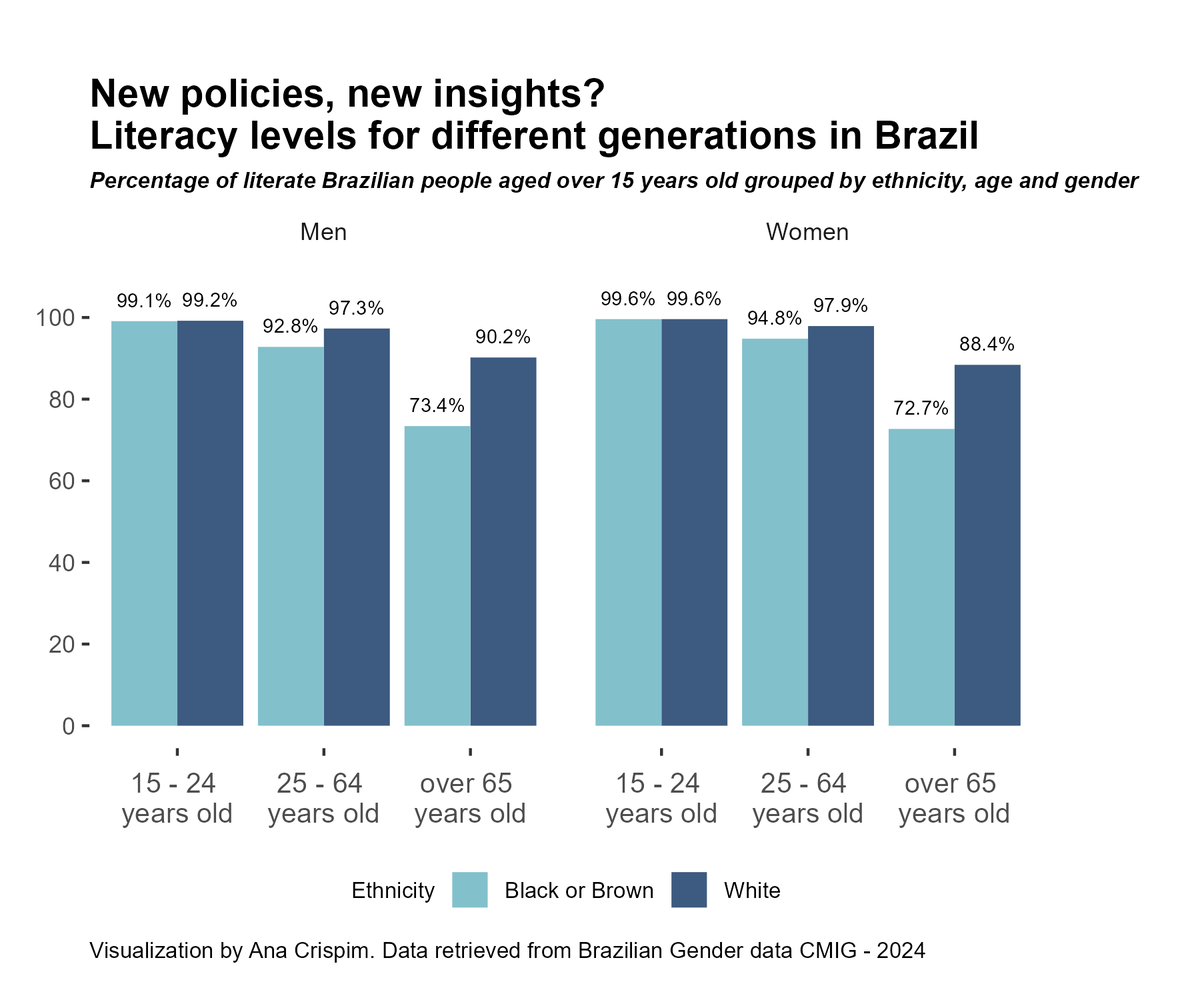
. Fit in educational data on the "neo" prompt was a challenge, but hopefully I can pass by using a pun-intended title? Here we have information about literacy levels over different generations and minority groups
#30DayChartChallenge