TON FAUCET FRENZY PHASE 2: $CATI is HERE! 🐱💥
Yo, Catizen fam – we feel the heat and GOATS got your back! 💪🐐 It’s time to turn things up a notch with FREE $TON just for you.
💎 50 $TON for 100 winners from the $CATI community
⌛️ Deadline: 4AM UTC, Sep 20th
How to join:
1⃣ Join https://t.co/IF9AItc1qq and complete TON Faucet Frenzy Phase 2 missions
2⃣ Retweet this post
3⃣ Drop your Airdrop screenshot of $CATI in comment section
$GOATS
#Giveaway 100 TON Gas #Free to 1000 @hamster_kombat CEOs
Need #gas_fee to claim your treasure? 🐹 CEOs, let's turn up the heat together! Join our giveaway and score 100 FREE $TON!
1️⃣ Join ONUS Tap Tap Tap: https://t.co/eQ2rmk6XqX & complete “Hamster Kombat” missions
2️⃣ Retweet this post
😉 The airdrop will end in 48 hours. No strings attached, just pure crypto bliss!
Understanding Factor Analysis📊
1/ Introduction:
Factor Analysis is like a detective tool for researchers. Imagine you have a huge pile of data, and you suspect there are hidden patterns or themes. Factor Analysis helps you uncover these hidden themes!
2/ Why use it?:
When you have tons of data, it can be overwhelming. Factor Analysis simplifies things by grouping similar data together. It's like sorting a mixed bag of candies into their respective flavors.
3/ Basic Idea:
Think of Factor Analysis as a librarian. If you give her a stack of books, she'll sort them into categories based on their topics. In the same way, Factor Analysis groups your data based on underlying patterns.
4/ Factors vs Variables:
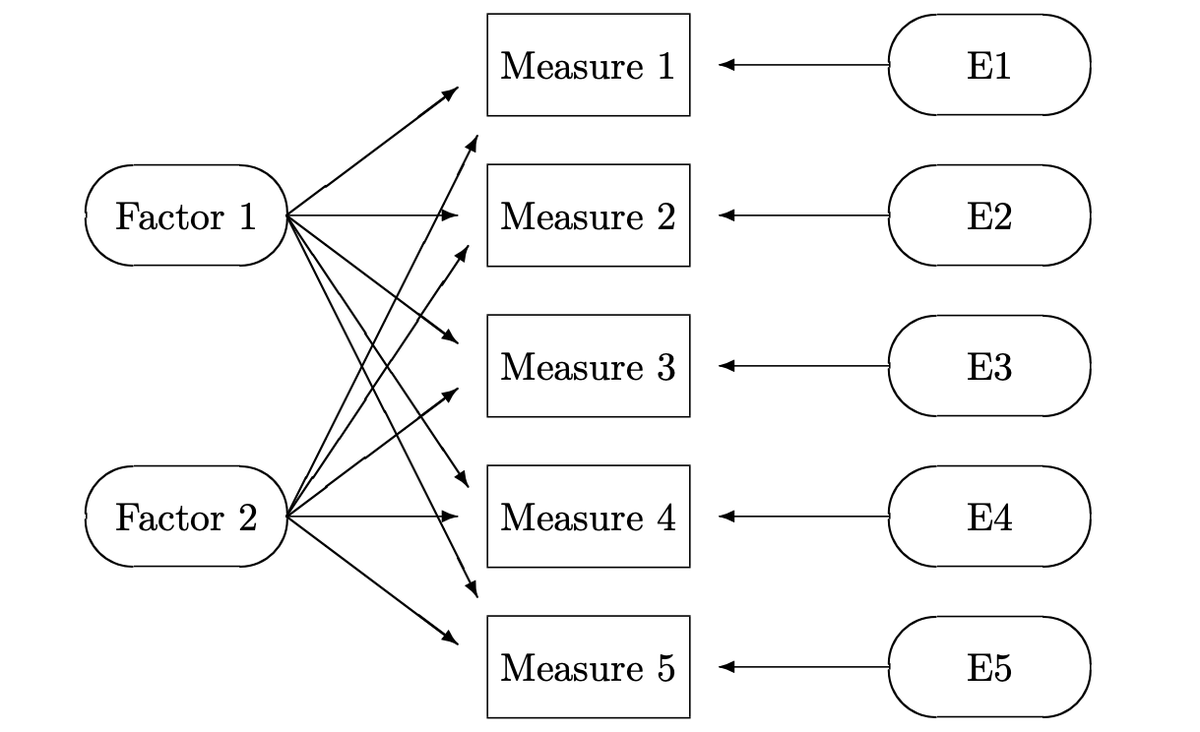
In our data, we have things we can measure directly, called "variables" (like height, weight, or test scores). But sometimes, there are hidden forces or "factors" (like health or intelligence) that influence these variables. Factor Analysis helps us find these hidden factors.
5/ Reduction:
One of the coolest things about Factor Analysis is its ability to reduce data. Instead of juggling 50 different pieces of data, it might tell you that most of them are influenced by just 3 or 4 main themes or factors.
6/ How does it work?:
Factor Analysis looks at how data points move together. If two variables (like time spent studying and test scores) often rise and fall together, they might be influenced by a common factor (like motivation).
7/ Visualization:
Imagine plotting all your data on a giant chart. Factor Analysis draws lines (or axes) that best capture the patterns in the data. These lines represent our hidden factors.
8/ Not a crystal ball:
While Factor Analysis is powerful, it doesn't "prove" anything. It suggests possible hidden factors, but it's up to researchers to interpret and validate them.
9/ Types of Factor Analysis:
Exploratory Factor Analysis (EFA): When you're not sure what you're looking for and want to explore.
Confirmatory Factor Analysis (CFA): When you have a hunch about the hidden factors and want to test your theory.
10/ Steps in Factor Analysis (oversimplified):
Collect Data: Get as much relevant data as you can.
Choose the Method: Decide on EFA or CFA based on your goals.
Run the Analysis: Use statistical software to crunch the numbers.
Interpret the Results: Identify the hidden factors and see how they relate to your data.
Validate: Check if your findings make sense and if they can be replicated.
11/ Real-world Applications:
From psychology (understanding personality traits) to finance (identifying investment themes), Factor Analysis is used in various fields to make sense of complex data.
12/ Conclusion:
Factor Analysis is like a magnifying glass for data. It doesn't give all the answers but reveals patterns and themes that can guide further research. It's a powerful tool for anyone looking to uncover the hidden stories in their data!
#DataScience #Statistics