Number seven on our speaker list are @miriamquick and @duncangeere. Wait... that's us! We've asked @AlliTorban to interview us about Loud Numbers, and our first episode, The Natural Lottery - which is released the same day. Get ready, because we'll be spilling *all* the beans 🔥
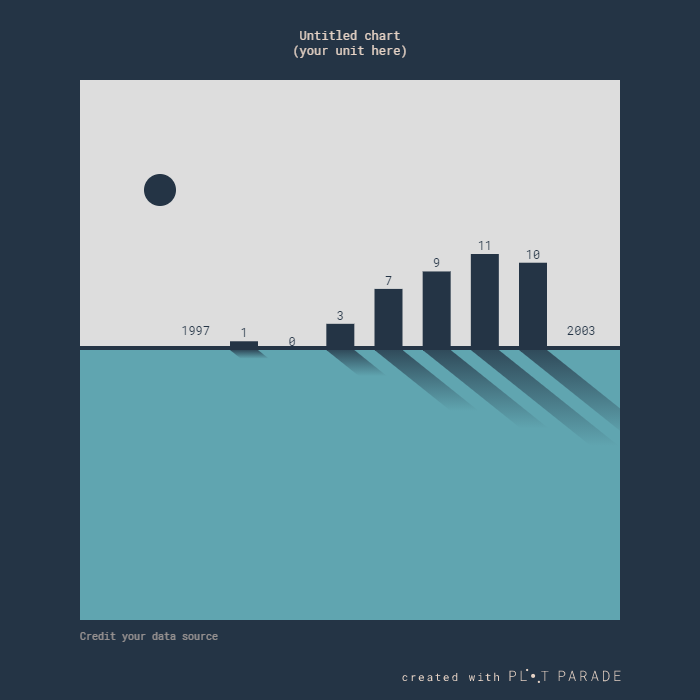
Zero effort chart: when I make a mistake in my code but it looks unexpectedly great!
Try it out on https://t.co/tUiPcyliAF
#D3js#dataviz#graphicdesign#chart
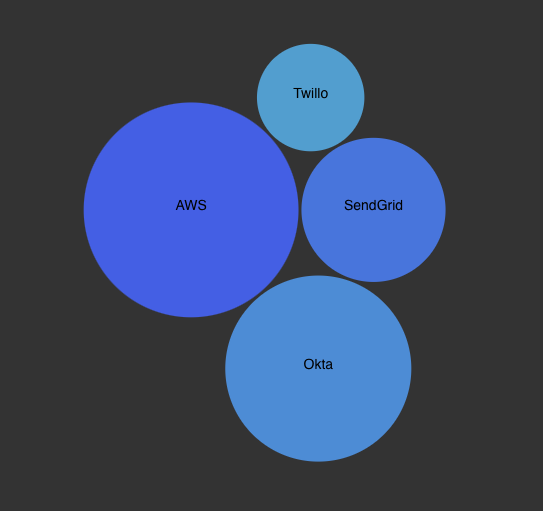
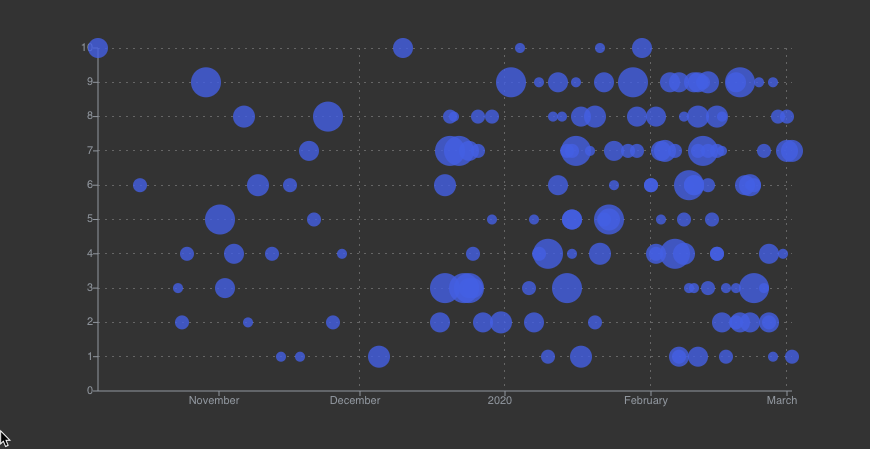
🎉 Bubble Charts landed in REAVIZ 10.2 - more to come but the initial version is locked in. We also have radial and linear bubble charts too!
👉 https://t.co/s91ApoX8IX
#d3js#react#javascript#reactjs#d3#typescript#dataviz
A year ago @hesheissa and I set a goal to learn how to create visualizations using #d3js 🤩
We gathered all the resources we used into one place to help anyone who also wants to learn D3.js but has no coding background!
https://t.co/Z79Xt9PTn3
Nice to see VS Code and Atom code editors have web server plug-ins. This makes developing JavaScript dataviz a bit simpler as you no longer need to install a web server 🎉 atom-live-server: https://t.co/b4hyngMqI3 VS Code Live Server: https://t.co/MluMzvWmJC #dataviz#D3js
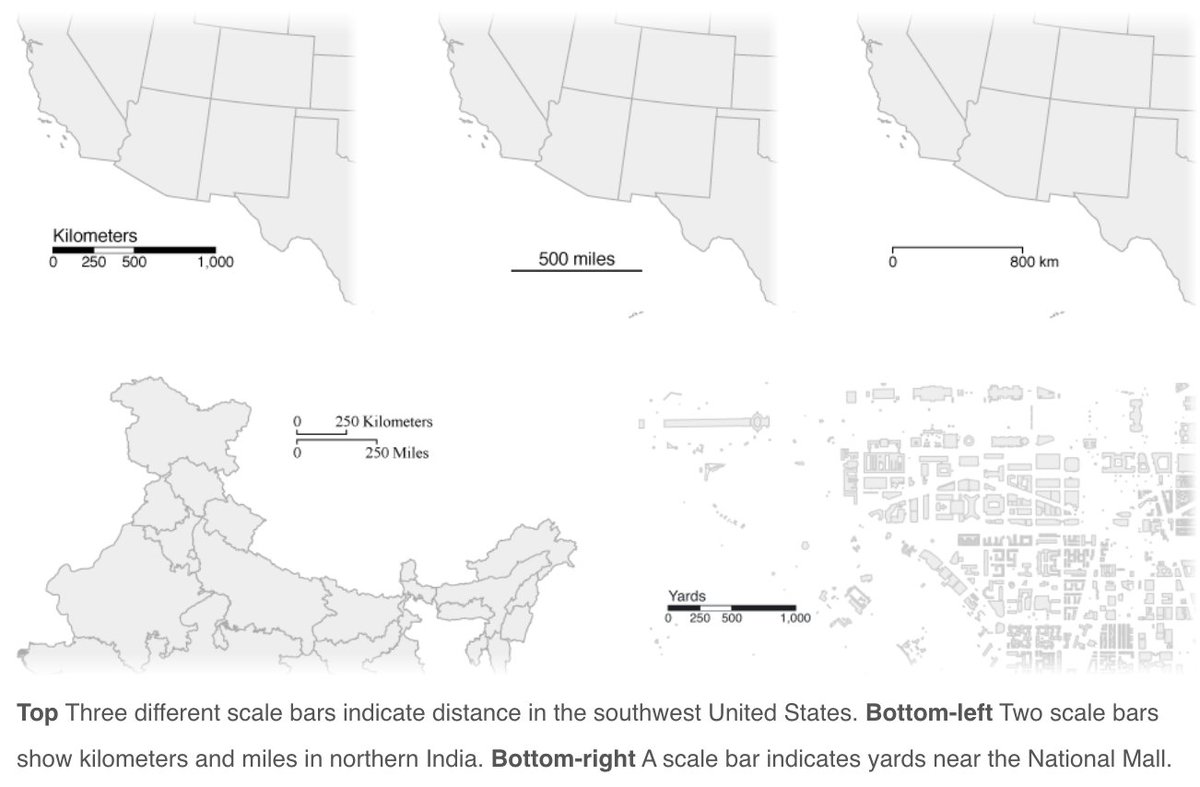
Attention web cartographers: Today I'm releasing d3-geo-scale-bar version 1! It's a JavaScript library that makes it easy to add scale bars to your #D3js maps. Here's an introduction and tutorial on @observablehq: https://t.co/XolMyScEVt #cartography
@rayannoliveira@LeafletJS@CodePen Hi Rayanne, so sorry for the delay - I've only just read your message! This is all on codepen e.g. part 3 is https://t.co/UsXg8o7cyd - does that help you?
Learn How to Visualise your Data on a Map using JavaScript. Part 3 of this 4 part tutorial just published! https://t.co/ZmJPzz0w26 @leafletjs#d3js#gis#dataviz@CodePen
I've just published Part Two of Make a Data-Driven Map in which we load CSV data using #d3js and draw markers on the map using @leafletjs. Happy mapping! https://t.co/cHCTcMqLsx #dataviz#gis#javascript
I've just published part 1 of Make a Data-Driven Map. Learn how to visualise data on a web map https://t.co/wXaCo8ZatL #javascript#gis#dataviz@LeafletJS