#Important
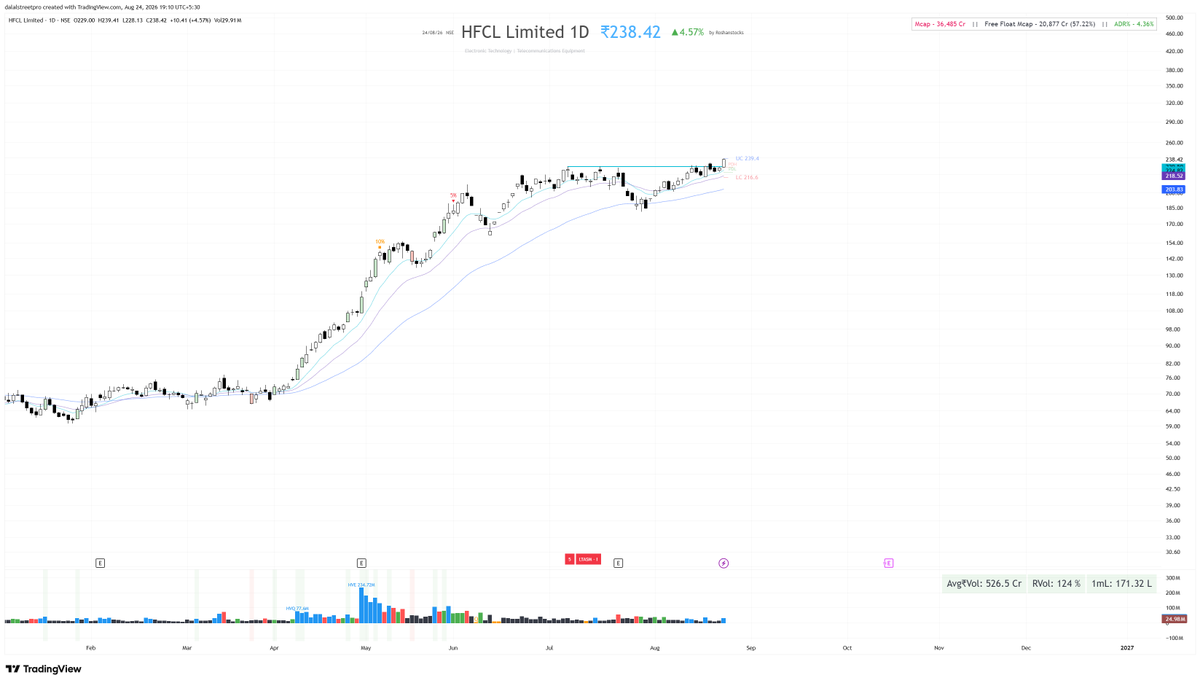
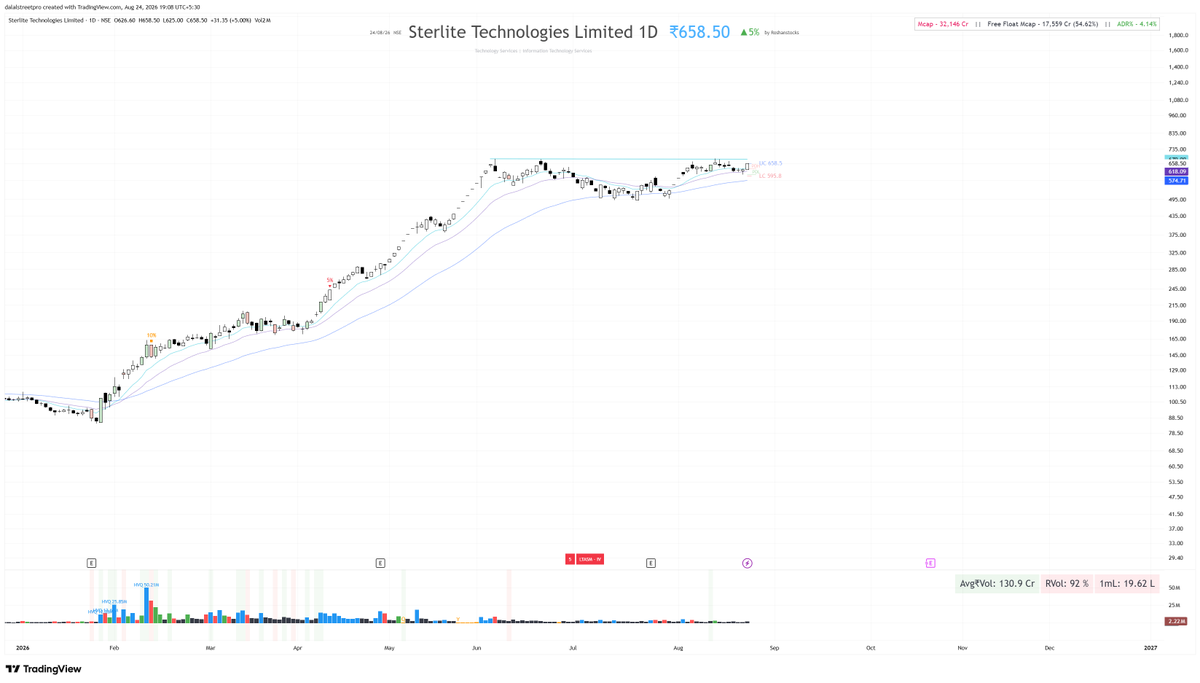
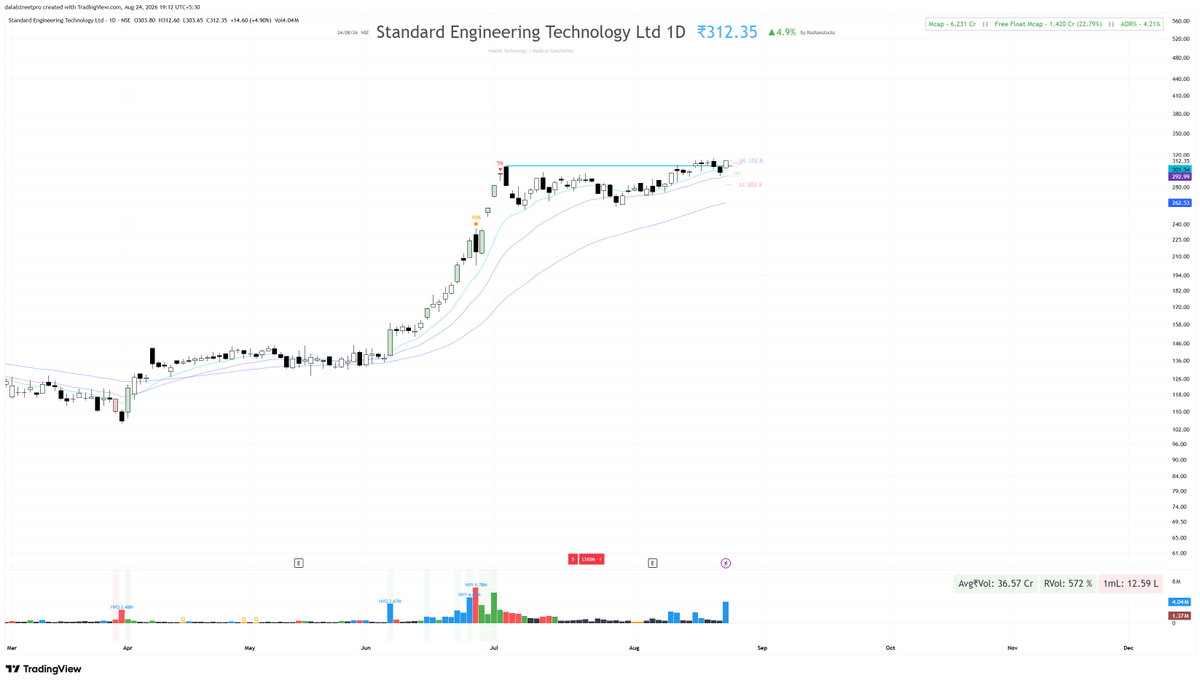
I've built a scanner to combine to monthly chart with Daily Chart to get supper bullish daily chart.
Rules:
1. Chart formed bullish on RSI monthly
2. Make entry on daily RSI Bullish chart.
Here is the early access. Use it and I will be keep tweaking as per results/understanding
https://t.co/QCnL9pQAqn
Today It gave 4 bullish charts.
Book Markt it. Retweet it.
Let's make trading simple!
#trading #investment #stockmarket
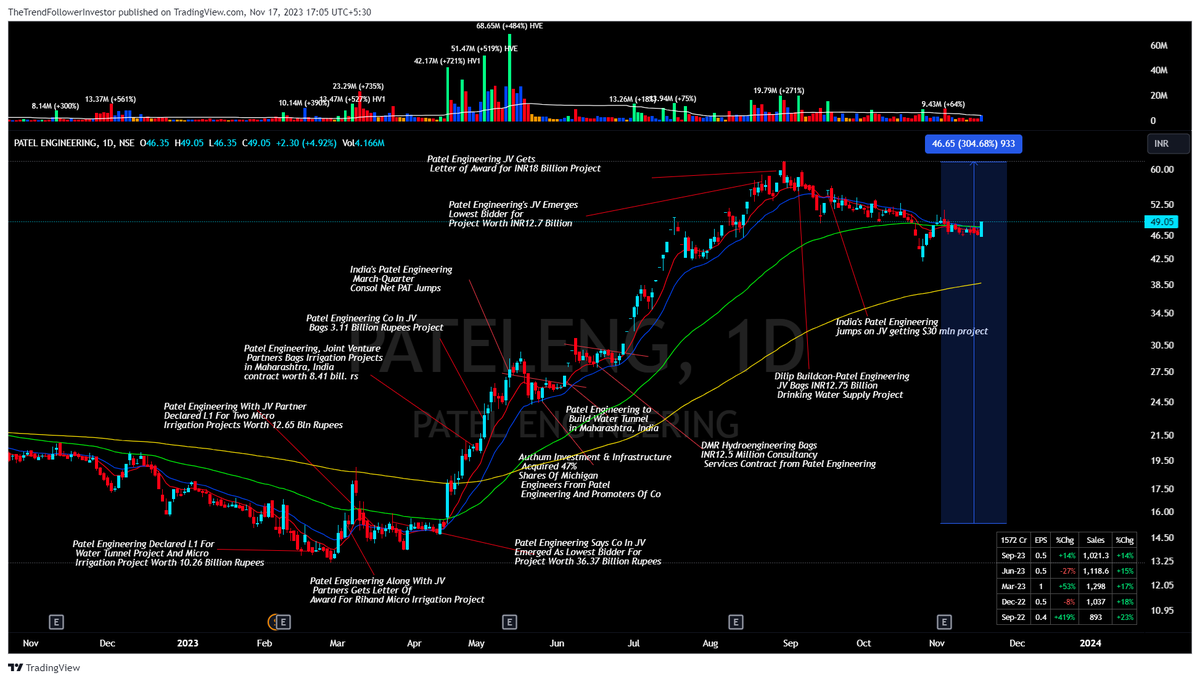
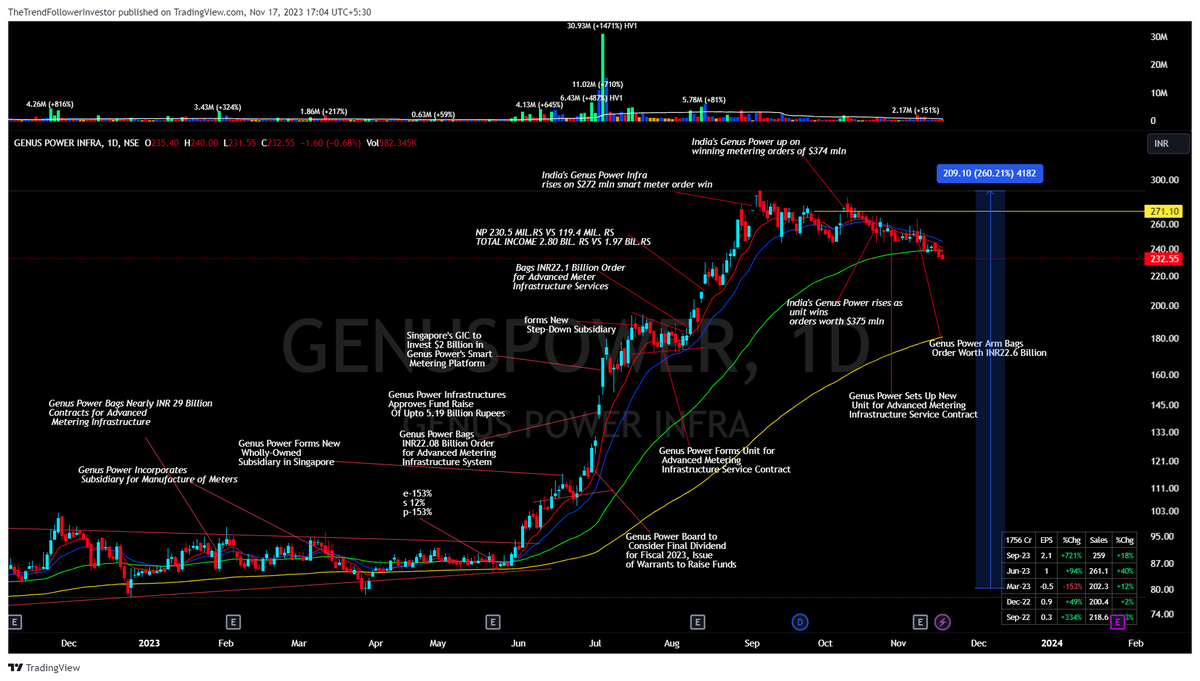
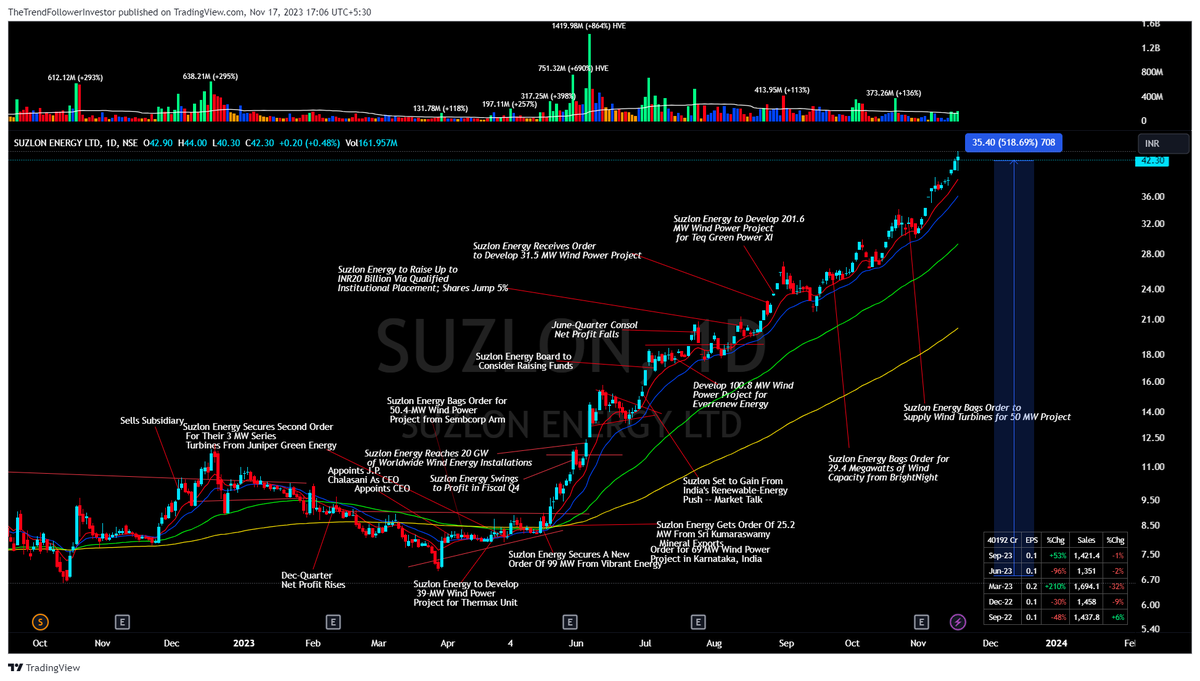
If you want to learn how market behaves then go through this list, look the growth catalyst into these companies for next two years and understand the price action !!
You will learn a lot 😉😃
#Protip
Made ₹5L on this trade.
But I tried "8 times" to get it.
This is how real trading works.
Even after 8 years of trading full-time, I still don't know which trade will make me money. I don't predict the outcome. I simply follow the risk-management system I developed for my Velocity trading style.
When I find a really good stock, I usually don't need 20 different stocks every month. 2 to 5 good opportunities are often enough.
I watch them constantly, from lower timeframes to higher timeframes and I may attempt multiple entries.
In this trade, I tried 8 times:
• 4 times → Stop-loss
• 2 times → Breakeven
• 1 time → Small gain
• 1 time → HUGE gain
That's trading.
When I enter a trade, I assume I can lose.
I calculate my 1R risk, take the position accordingly, and then my next job is simple:
Protect my breakeven as quickly as possible.
I have developed a few simple rules around this, while giving the stock enough breathing room according to its volatility.
I don't think about the profit anymore.
The market forced me to learn this during my first 5 years.
Back then, I was always thinking:
*"How much money will I make from this trade?"*
Looking back, it sounds immature but that's how almost everyone starts.
Over the years, I tried countless strategies, setups and timeframes.
Eventually, I understood one thing:
"Never depend on a single entry in a good setup., try multiple times"
and also
Don't enter a trade thinking, "This one will make me money."
Instead, focus on:
Risk → Entry → Protect BE → Give the trade room → Exit if you're wrong.**
I did exactly the same thing here.
Bought → 1R loss.
Bought again → Breakeven.
Bought again → Stop-loss.
Again. And again.
Until finally, one entry caught the move.
That's how real trading works, my friend.
I always tell my students:
Don't keep buying bad stocks hoping they will work.
Find a good stock.
Then keep trying to enter it intelligently.
Story stock is the most powerful concept introduced by @PradeepBonde and I'm 100% agree with pradeep they give very fast returns in very short time, and its also working in indian market from last 20years below are the few examples-
A good setup to watch for the next breakout.
A simple tightness stock-selection setup:
1) 30-day average volume above 1 lakh shares.
2) Stock has gained more than 20% in the last 3 months.
3) Current price is still within 1% of its 3-month-ago price.
https://t.co/tTQZL5wsgU
IPOs have been working good lately.
Have a scanner for it.
You don't need anything exotic
TradingView's screener does the job for me.
Widen the IPO window to 12 months if needs bigger list.
Since IPOs have no strong overhead supply hence probability of working is high.Swing process doesn't change. Fresh buying on tight candles. Range contracts, volume dries up then you get the expansion.
Same setup I keep talking about, just applied here too.
I will sometimes drop to the 1h to see where supply and demand sit inside the base. Helps with entry but daily also tells you what you need.
Things people get wrong here:
IPO bases are shorter than normal bases. Sometime 2-3 weeks can be enough , don't wait for a textbook 4-6+weeks structure.
$SPCX $QNT $JAN $JMKE $MMED $IOND MOLBIO KISSHT etc.
#SHILPAMED
I see a
Significant contraction above the rising 10DMA.
A shakeout demand tail to remove weaker hands.
An Inside Bar indicating that the volatility contracts further.
Overall.. a very interesting setup but need confirmation.
I want to see range expansion in BOTH price & volume, preferably a strong breakout above the mother candle high.
Weekend Bliss!
Weekly Chart Bullish Scanner Run it after Friday's market close to find bullish weekly setups and shortlist potential swing trades.
https://t.co/ELaJN6F66E
Keep Learning. Pls Retweet!
#trading#investment#stockmarket#nifty#RSIEDGE
Right stock + Big position = Wealth creation.
Right stock + Small position = Opportunity wasted.
Wrong stock + Small position = Tuition fee.
Wrong stock + Big position = Portfolio destruction.
Position sizing is where conviction becomes wealth or stupidity becomes loss.
🔍Stock Deep Dive — Weekly Edition | Part 1
#VINYLINDIA
The goal isn't to catch the entire move.
The goal is to identify the area where we could potentially grab a part of a big move.
#VINYLINDIA gives us a great example:
• Strong Stage 2 uptrend
• ~42-week base
• ~32.7% correction, but no major sell-off
• Good buying candles with volume
• Volume drying up during consolidation
• Contraction near the 10 WEMA
• Breakout → shakeout → breakout
• Then a massive ~200% rally
Weekly chart first.
Daily chart later.
#StockDeepDive #WeeklyEdition #ChartReading #PriceAction #VCP #SwingTrading #NSE #TechnicalAnalysis
Learn to identify the supply bar, so that you don't take entries in such stocks baar-baar.
What is a supply bar?
A supply bar is a red power volume.
What is a power volume?
Power volumes are volumes beyond a certain number, the default being half a million, where price moves a minimum of 5%. (credit to @iManasArora for this "purple dot" concept)
How to identify supply bars / power volumes?
Use the Simple Volume indicator and turn on the Power Volume option in the settings, as well as in the Paint Bar section.
How long does a red power volume act as a supply?
Till its high gets taken out convincingly, or till a sufficient period of time passes after the appearance of the supply bar.
Does this work 100%?
Nothing works 100%, so analyse with context. Outliers will be there.