🚨 WARNING: S&P 500 MAX DRAWDOWN IN EVERY MIDTERM ELECTION YEAR:
1962: -28.0%
1966: -22.2%
1970: -36.1%
1974: -48.2%
1978: -14.1%
1982: -27.1%
1986: -9.4%
1990: -19.9%
1994: -8.9%
1998: -19.3%
2002: -33.8%
2006: -7.7%
2010: -16.0%
2014: -7.4%
2018: -10.2%
2022: -25.4%
NOT A SINGLE POSITIVE RETURN IN 60 YEARS
2026 WON'T BE DIFFERENT
Keep in mind: I’ve called every major market top and bottom for over 10 YEARS.
I was one of the only people who called the top in October, and I’ll do it again.
That’s literally my job.
If you still haven’t followed me, you’ll regret it.
Gold miners are trading at one of the deepest discounts to the S&P 500 on record.
Fundamentals remain strong.
Prices keep falling.
This is what an accumulation phase looks like to smart money.
https://t.co/2cbnnBkfEd
Today was a good reminder of this chart.
It's remarkable that miners are still printing free cash flow even with metals trading at deeply oversold levels.
Act accordingly.
https://t.co/SuGW6VYo0C
The 2-year real interest rate has now climbed to its highest level since the Trump administration took office.
At the same time, we are living through the deepest and longest drawdown in the history of the Bloomberg US Aggregate Bond Index.
We are moving in the wrong direction and I doubt Scott Bessent is thrilled about either development.
This is the exact opposite of inflating your way out of a debt problem.
Yet investors are increasingly pricing in the possibility of another rate hike.
I suspect policymakers will be forced to address that reality.
When they do, the implications for hard assets could be substantial.
https://t.co/CErNysNiBQ
Silver prices vs. global production:
When structural demand collides with stagnant production.
You can’t just flip a switch and grow mine output overnight.
Discoveries are rarer, permitting is harder, grades are falling, and development timelines keep getting longer.
Contrary to what most believe, this is not a speculative bubble.
It is the market adjusting to a new reality of structurally higher resource prices.
Wake me up when production actually starts surging.
https://t.co/MQnJnDEHrh
Silver price targets in USD - major banks (updated 29 May 2026).
Silver is trading at $75.83 as of 1.45pm EST Friday.
BANK OF AMERICA: $135.00 to $309.00 per ounce year-end target range (scenarios built on gold-to-silver ratio compression), with a tactical target of $100.00 in Q4 2026 and an annual average forecast of $85.93.
UBS: $80.00 per ounce year-end target (revised down from $85.00), with a full-year average forecast of $65.00.
J.P. MORGAN: $85.00 per ounce fourth-quarter target high, with a full-year average forecast of $81.00.
GOLDMAN SACHS: $85.00 to $100.00 per ounce full-year average target range.
CITIGROUP: $110.00 per ounce second-half target (with an optimistic Q2 target peak of $150.00).
ING: $78.00 per ounce full-year average target.
HSBC: $70.00 per ounce year-end target, with a full-year average forecast of $75.00.
COMMERZBANK: $90.00 per ounce year-end target.
BMO CAPITAL MARKETS: $160.00 per ounce fourth-quarter target (assuming compression of the gold-to-silver ratio to the 40–50 range).
TD SECURITIES: $118.00 per ounce annual high target, with a bearish full-year average baseline of $44.00.
CIBC: $105.00 per ounce year-end target.
SCOTIABANK: $65.00 per ounce average target.
ROYAL BANK OF CANADA: Qualitative bullish outlook (Outperform rating on silver equities with an individual $75.00 equity target).
BNP PARIBAS: $100.00 per ounce year-end target.
BAIN COMMODITIES: $85.00 per ounce peak target, with an annual average of $63.50.
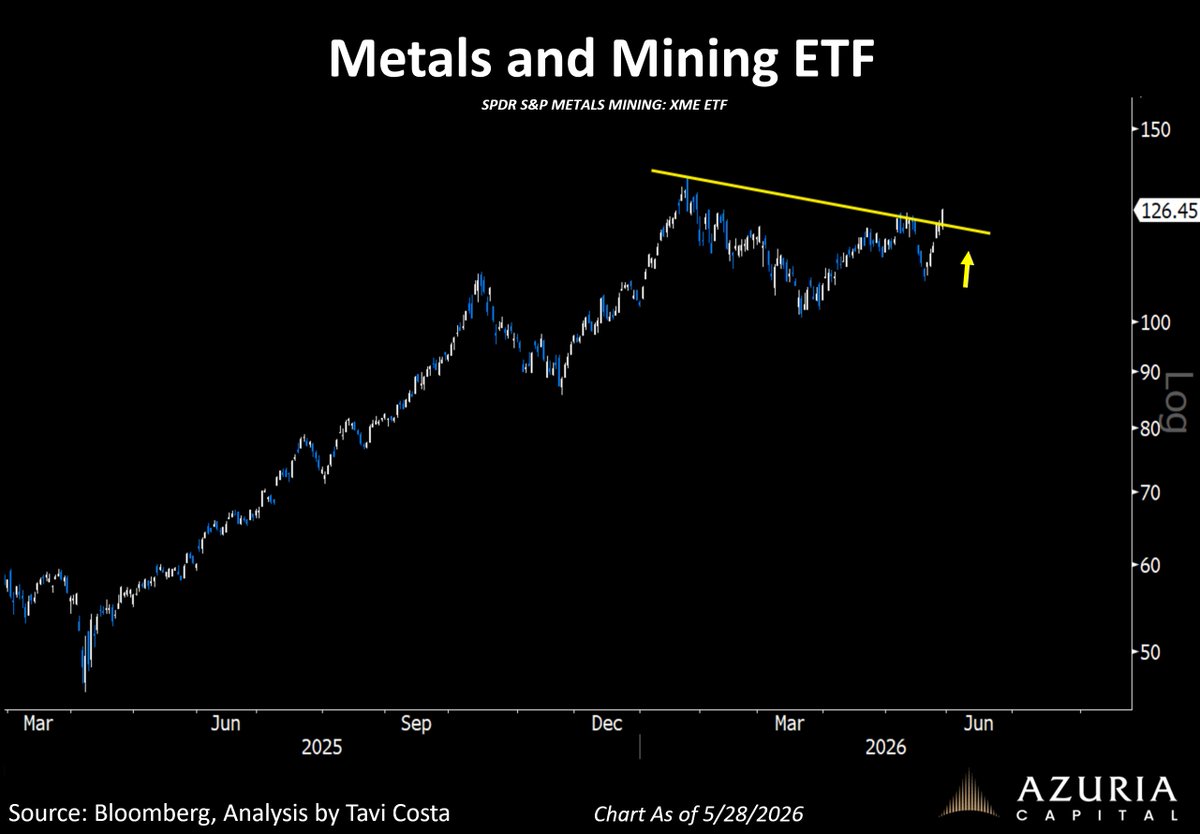
The Metals and mining ETF broke out today.
Copper miners are leading the way with copper itself now entering what looks like a true price-discovery phase.
Also worth noting that the ETF below includes several steel producers as well.
Overall, this is a very constructive development for the industry in my view.
https://t.co/u4CIp7K2HH
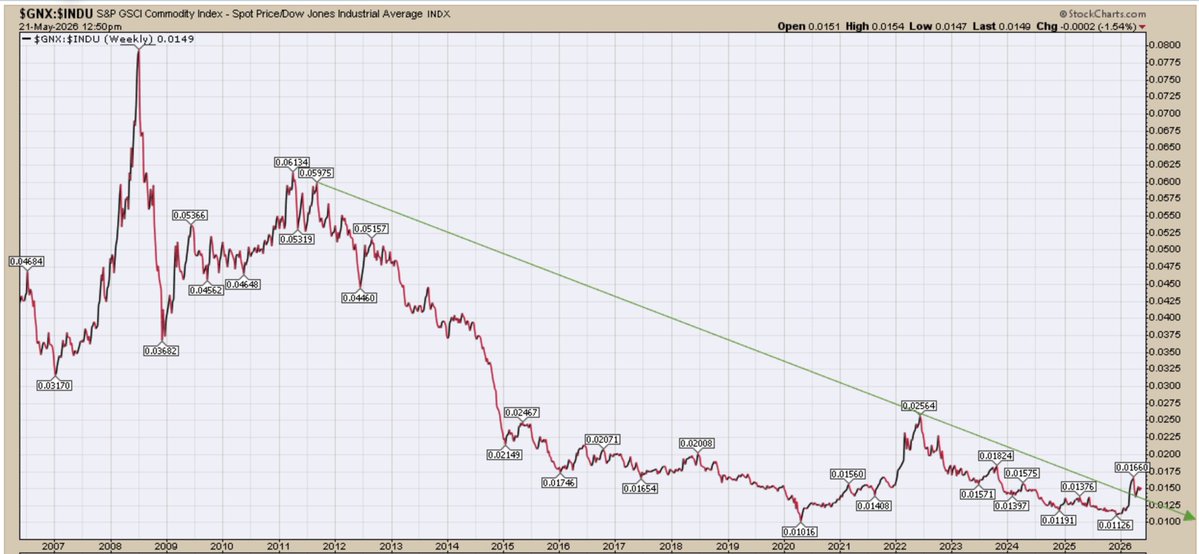
HUGE
Commodities breaking out from a 15-year DOWNTREND, versus general equities
Huge confirmation of the start of this new commodities BULL market, which could lead to a decades long outperformance
Still very early in this revaluation phase
Wish I owned a commodity fund :-)
Gold miners are now doing more share buybacks than at any other point in history.
We have never seen anything remotely close to the scale of what is happening today.
This is a direct consequence of the extraordinary profitability the sector is generating at current metal prices.
https://t.co/eoj7D4wiYz
What a remarkable reversal in the miners today.
Junior miners turned positive and the senior producers quickly followed.
It’s astonishing to see investors continue selling this industry after strong inflation data, when logically the response should be the exact opposite.
The Fed cannot repeat the 1970s playbook today without blowing up the most leveraged financial system in history.
Welcome to an unhinged inflationary era.
Game on.
https://t.co/Ljlw1vel3b
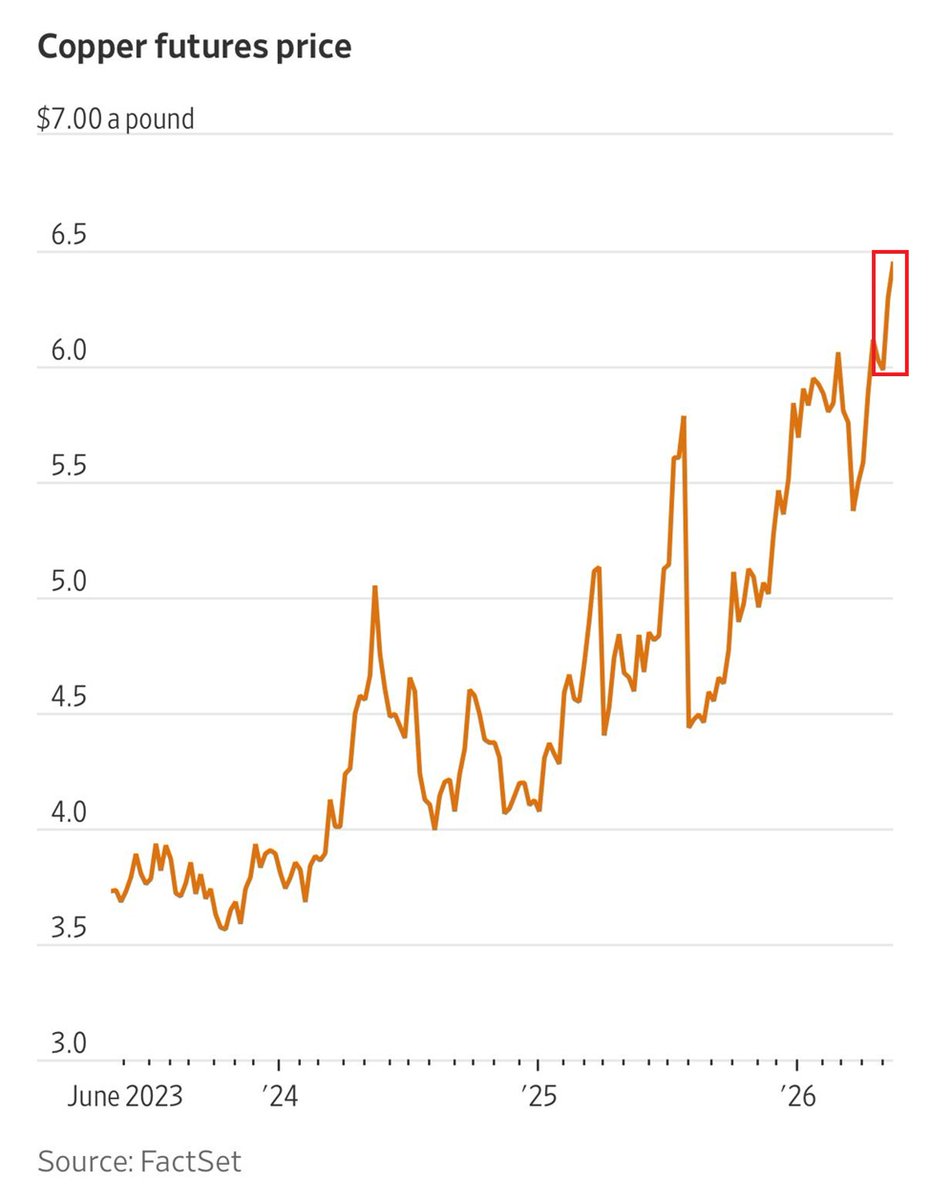
BREAKING: Copper prices have surged to a record $6.58 per pound, now up +75% since October 2023 and over +40% in 12 months.
The surge comes amid tight supply, declining inventories in China, and surging demand for data center construction.
Furthermore, supply disruptions at the world's 2nd-largest copper mine in Indonesia are adding to the pressure.
Meanwhile, China's exports jumped +14% YoY in April, led by booming clean-tech shipments, components that are materially copper-intensive, tightening the market even further.
The global economy is scrambling for copper.
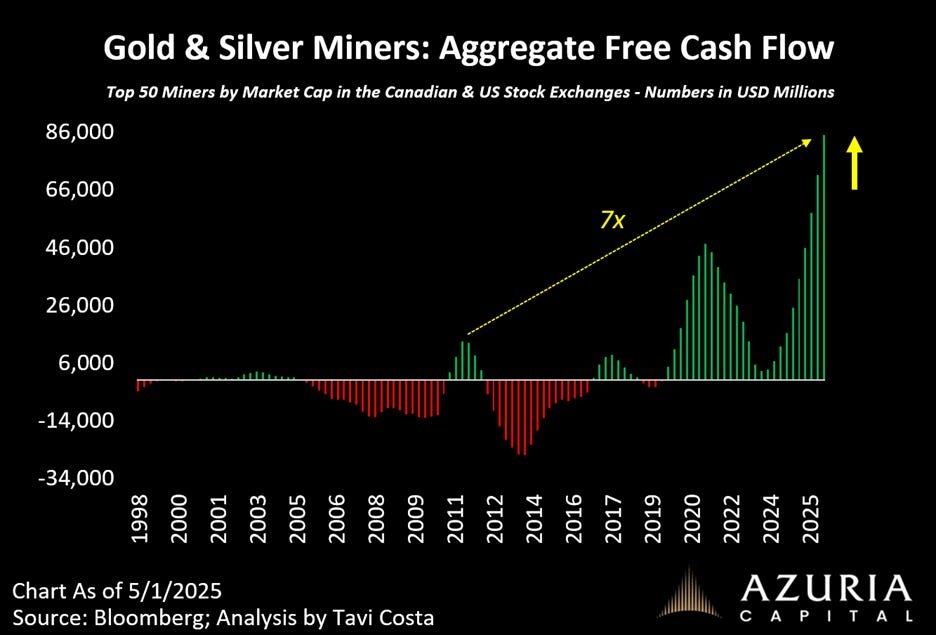
A new era for the mining industry.
Miners are generating roughly 7x what they did at the peak of the last cycle.
I’m old enough to remember when this space was considered “uninvestable” by the so-called experts.
Game on.
https://t.co/ssIdeKrny6