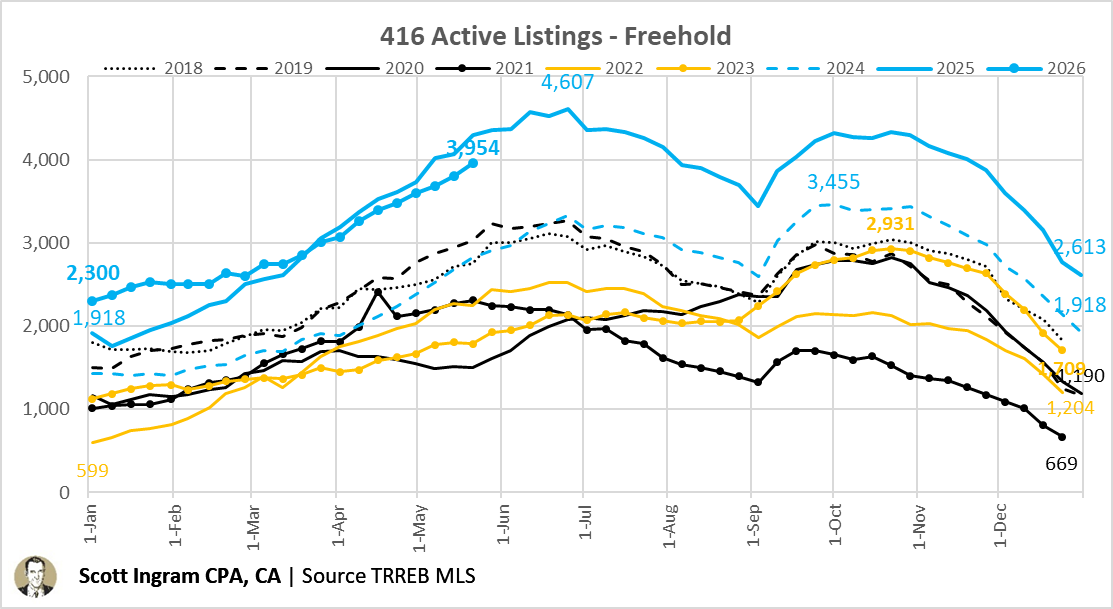
Sales for Freeholds have kept within 1.5% of the seasonal peak (1242) in the last 4 weeks. MOI was identical to the prior week at 3.23.
Condo sales have varied a bit more in the last 4 weeks (4.0% spread from high to low), but with the active listings drop last week, MOI dipped. /3
Weekly 416 Active Listings and MOI 🧵
Freeholds are +42 w/w, the lowest increase since March 17, and below the +121 average of the last 10 weeks. One week isn't a trend but perhaps we're slowing to a peak lower than last year. /1
Condos are actually ⬇️111 (-1.6%) for the week, the first downtown (of more than 2) since March 3. Can see this year has been a much less steep climb than 2024 and 2025. It's just a bit higher than 2024 currently (+43). /2
I really like this transparency move by TRREB. Of course you can go back and look up a listing's history, but to have the cumulative DOM right up front is a great step forward (even if it's way overdue).
[Matrix and REALM are the 2 different MLS systems realtors can choose to use from.]
Agree that at least it's not a "new listing." And there aren't too many "clever" agents doing this particular manipulation, but it makes me wonder if there should be some sort of minimum price change.
(I also personally think there should be a minimum time before being allowed to relist, like at least 30 days)
Some MLS screwing-around from these sellers. Doing a price change (PC) gets you sent out again in people's daily listings feeds.
Original price: $1,399,900
New price: $1,399,990
C'mon, $90. An increase no less - after being on the market for 13 months.🙄
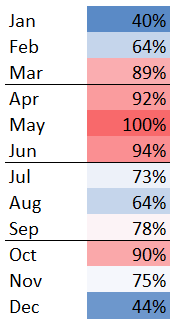
Timing of 416 Condo market sales versus Freehold sales for last 10 years (2016-2025). Shown as a % of the top month for each.
Condos: peak in March, don't fall off as much in Dec/Jan (59% min)
Freeholds: peak in May, clear peaks in spring and fall, wider range (40% - 100%)
Here's the split of 416 freehold (house) sales from 2016-2025 by month, indexed to the highest month (May) being 100%. I prepared this for a client to show that listing in June is still in time for the spring market.
They assumed they should just wait for September. But even July has averaged almost as many sales as Sept. Of course there are factors with the family's life that may get in the way of listing quickly, but I wanted to show them listing now is still a viable option. /1
Also note just how dead Dec (44%) and Jan (40%) are, although sales still happen every day of the year.
And I find it really interesting that Feb and Aug have the same amount of sales (64%), though Feb is the market waking up, and August is the market taking a summer rest. /2
Noticed in TRREB's 2025 financial statements that membership declined by 4,200 members year over year.
Less transactions, working longer to sell places, declining prices are all making the career less attractive to some. The culling of the herd...
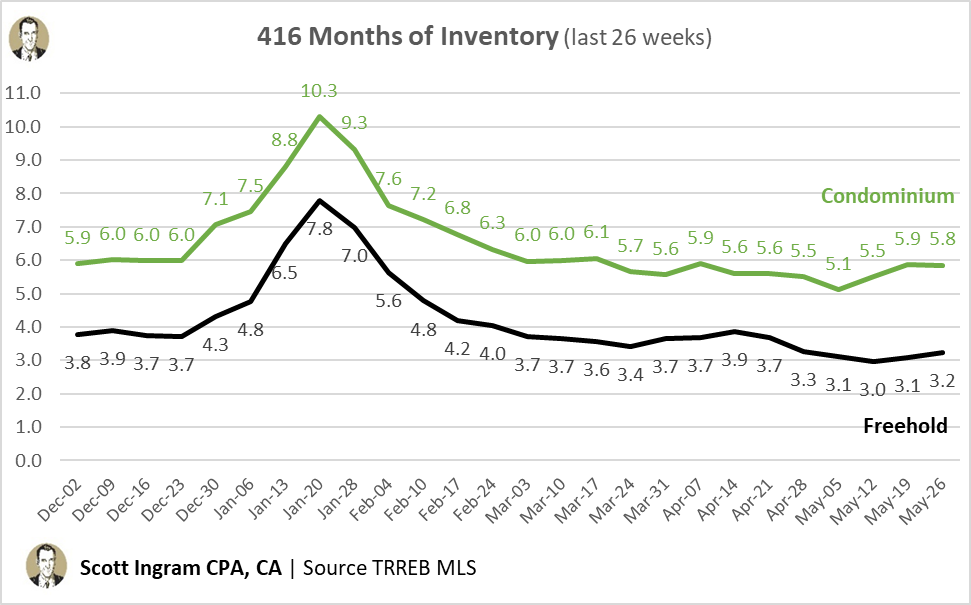
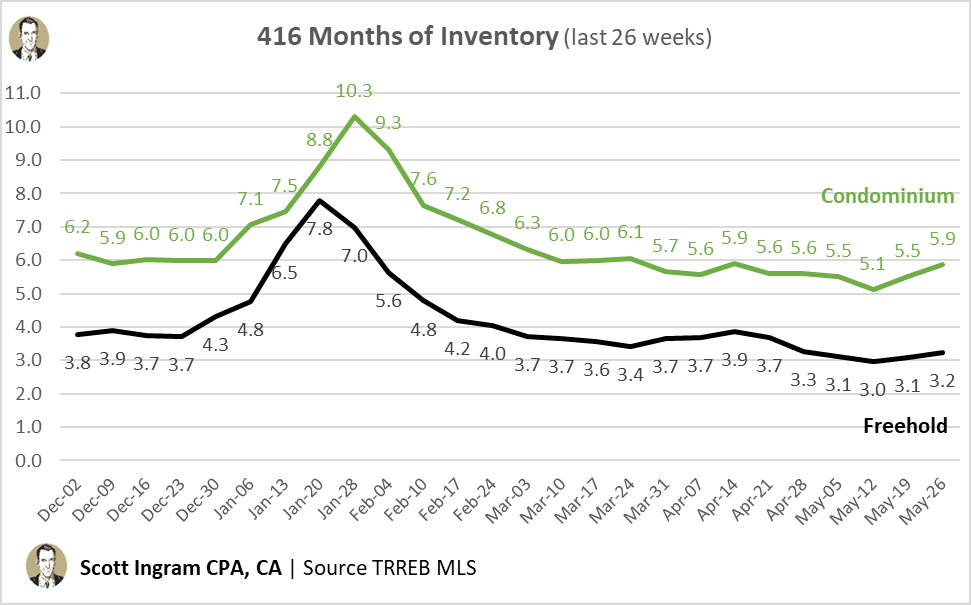
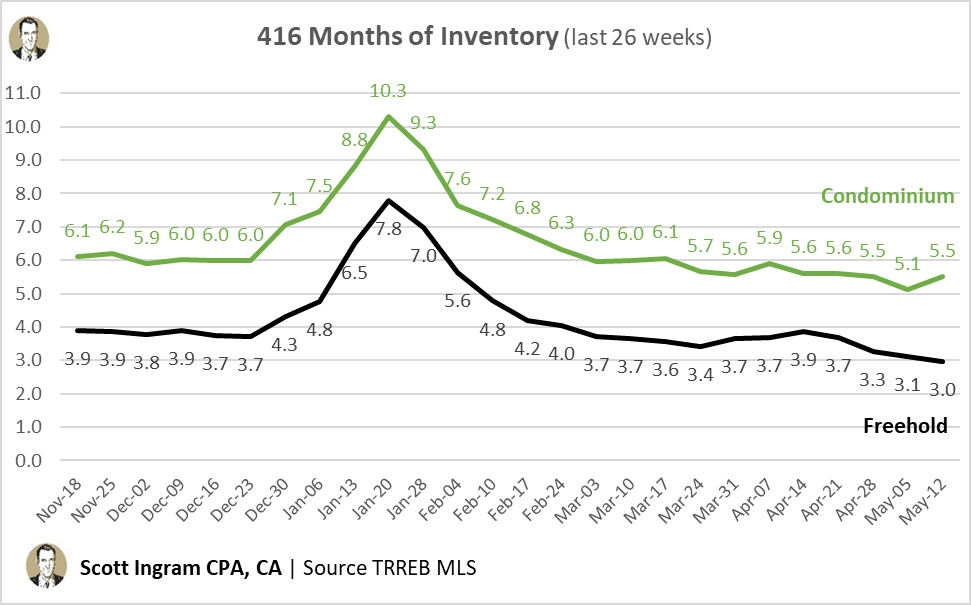
Correction on this MOI chart. I forgot to update the Condo line to add in the new week (drop from 5.86 to 5.846)
Thanks to @anonnnnnnnnmn for double-checking.
From it's 2026 low of 2.97 two weeks ago, Freehold MOI has risen to 3.08 and now 3.23. Sales peaked 2 weeks ago (but are only sitting 1.4% below the peak), while inventory continues its steady rise.
Condo MOI had sales peaked 3 weeks ago, and is now sitting 6.8% below that. /3
From it's 2026 low of 2.97 two weeks ago, Freehold MOI has risen to 3.08 and now 3.23. Sales peaked 2 weeks ago (but are only sitting 1.4% below the peak), while inventory continues its steady rise.
Condo MOI had sales peaked 3 weeks ago, and is now sitting 6.8% below that. /3
Weekly peek at 416 Active Listings and MOI 👀
Here's Freeholds (houses). Up 150 in the week (+3.9%), highest w/w jump in 6 weeks. Was the week after Victoria Day so many wait until after the long weekend to list. Just below 4000, and looking like it's tracking to 2025 numbers. 🧵/1
Here's the Condo story. Up 75 in the week (+1.1%). Lowest increase in 3 weeks. Inventory buildup has been less steep than 2025 or 2024. The last 13 weeks has averaged +92 week over week. /2
Both MOIs are up, Condos by a good chunk - back to where they were 6 weeks ago at 5.9. Freeholds (houses) pretty even in the last 3 weeks.
Since we're right after a long weekend, there could be some funk in this week's numbers (slower sales, new listings withheld). /3
Weekly Active Listings and MOI update.
Condo listings still at a steady climp. They're way below last year, but only about 650 below 2 years ago (which was the highest in some time). Spring appear to have peaked two weeks ago. 🧵/1
Freeholds up again (+121 w/w, which is close to the average of +118 over the last 9 weeks). Sitting about 800 behind last year's peak. Sales were flat w/w so has the spring peak leveled off? Had increased in 16 of the last 17 weeks. /2
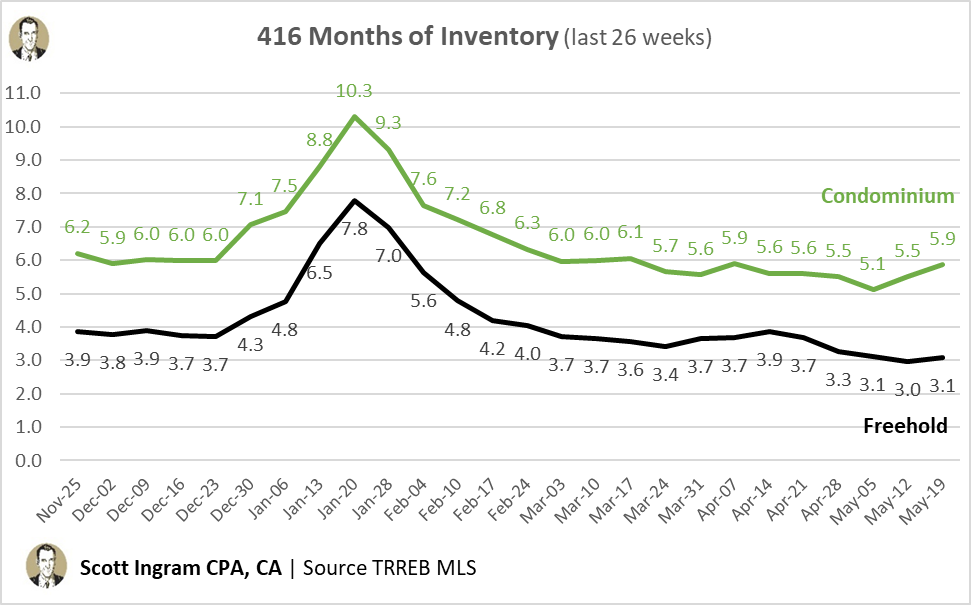
Quick update on weekly MOI. Freehold has snuck under 3 months (2.97), while Condos have reverted back to the 5.5 to 5.6 range they were in the 3 weeks prior to last week's 5.1 (which looks like a weird blip).
30 days of sales for Freeholds are again at a 2026 peak, while Condos slid back a bit.


![areacode416's tweet photo. I really like this transparency move by TRREB. Of course you can go back and look up a listing's history, but to have the cumulative DOM right up front is a great step forward (even if it's way overdue).
[Matrix and REALM are the 2 different MLS systems realtors can choose to use from.]](https://pbs.twimg.com/media/HJu0fGLXoAANL4k.png)