Was asked about if the chart pattern on $XRP, Silver, and now $CRV is applicable to other fundamentally sound alts "that are in similar chartwise positions as CRV" too. The user below then suggested $QNT as an example.
The answer is YES, a HTF accumulation bottom is a "universal" structure that can be applied to ANY market HOWEVER, when it comes to crypto you have to make sure you're looking at a chart with COMPLETE price history.
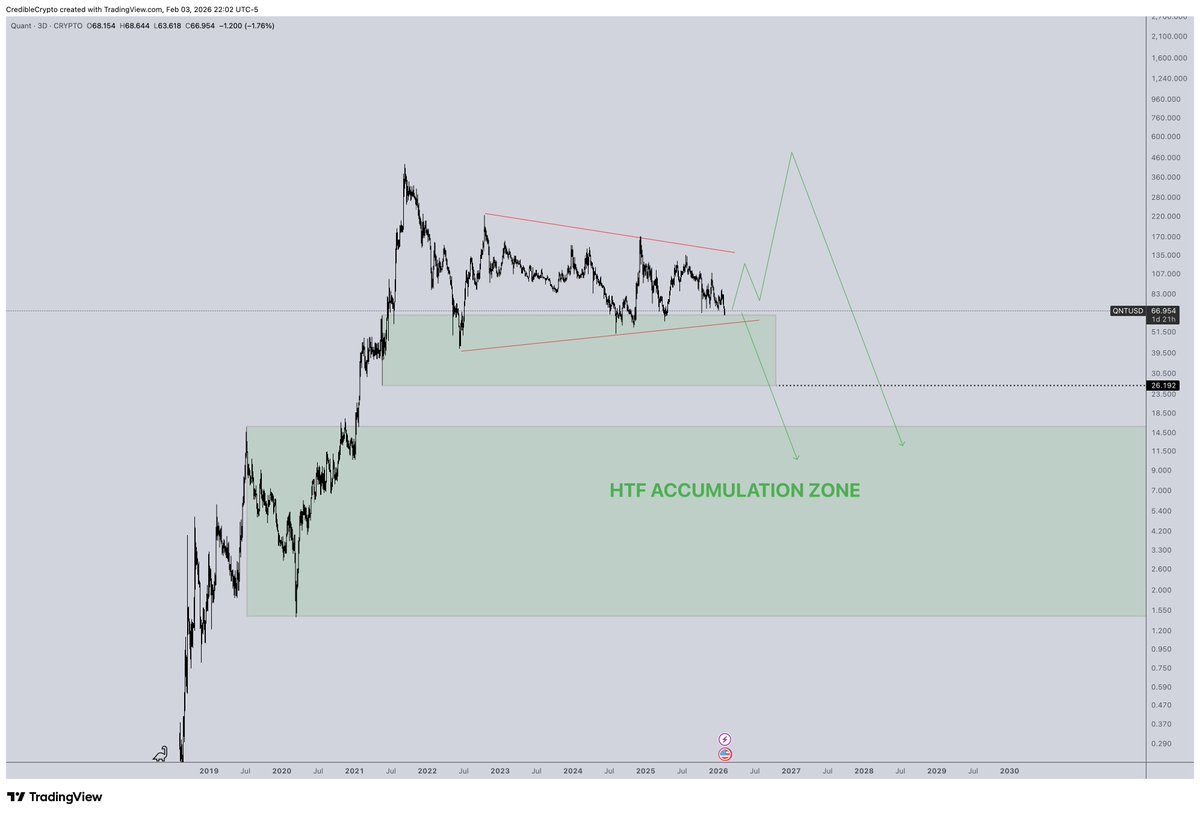
For example, if you look at the complete chart history of $QNT this is what you see:
1. First off, we don't have an accumulation base with a deviation and reclaim of range lows- so already this is not the same structure as something like $CRV.
2. When looking at complete price history we can see QNT went from $1.40 in 2020 to over $430+ at it's peak just 1 year later, an over 300x rally off of it's bottom already, just in the last 5 years. Compare this to something like CRV that is still AT that same bottom over the last 5 years, not 50x above it.
3. $QNT is still "digesting" its 400x move and currently forming a "neutral" consolidation structure, which could theoretically break either way, rather than a bullish accumulation base at macro range lows.
4. $QNT has HTF support in the green zone right now but you can see we've been testing it for essentially the entire consolidation. This is very reminiscent of $BTC at the 6-12k consolidation before our breakdown to 3k back in 2018.
If I had to analyze this chart, I would expect one of two of the paths below to play out- meaning, ultimately, I would not be too interested in QNT until/unless we hit $15 ish.
This is why it's important to make sure you are seeing complete price history of any given asset.