Stanford professor Judy Fan went on stage at MIT and broke down why humans are so good at making the invisible visible...
And why AI hasn't actually learned to "see" the way we do.
It completely changes how you think about Human Intelligence v/s Artificial Intelligence:
1. Nature never gave us straight lines or sharp corners. The number line, the coordinate plane, even basic geometry are all human inventions. We created tools that do not exist in nature simply because we needed a way to think more clearly.
2. The coordinate system Descartes invented solved a problem that had stumped mathematicians for centuries, doubling the volume of a cube. Once invented, this tool became so indispensable that virtually every math curriculum on Earth still depends on it.
3. Humans have been doing this for at least 30,000 to 80,000 years. The story of human progress is inseparable from the story of marking up our environment, from cave walls to Galileo's telescope to Feynman diagrams of particles we will never see with our own eyes.
4. Every major scientific breakthrough relied on a visual tool that made something invisible visible. Darwin needed side-by-side illustrations of finches to see variation that was otherwise too subtle to notice. Cajal needed detailed drawings of neurons under a microscope to map how the nervous system was wired.
5. Fan's research group studies something deceptively simple: how people decide what to put into a drawing and what to leave out. When two people played a drawing game, sketchers used far more detail when the target object had close competitors than when it stood alone, all the way down to using fewer strokes and less time when more detail was not necessary.
6. People are not just copying what they see. They are making constant judgment calls about what level of detail actually serves the goal of communication, and they do this naturally without ever being taught the theory behind it.
7. There is a real difference between drawing something so someone can identify it and drawing something so someone can understand how it works. In one study, participants drew explanatory diagrams that emphasized moving, causal parts of a machine while depictive drawings emphasized background and overall appearance, even though both were drawing the exact same object.
8. Explanatory drawings were genuinely better at helping someone figure out how to operate a machine, but worse at helping someone identify which machine it actually was. You cannot optimize a single drawing for both goals at once. Communication always involves tradeoffs.
9. AI vision models trained on photographs generalize surprisingly well to simple, sparse sketches, suggesting that resemblance based recognition is not just a story we tell ourselves. It is something modern neural networks can replicate with real accuracy.
10. But there remains a large, measurable gap between how confidently AI models recognize sketches and how confidently humans do, even when both groups answer the same questions about the same images. Humans are simply far more reliable and far more consistent in their judgments.
11. When researchers compared human-made sketches to AI-generated sketches under tight stroke budgets, both were similarly recognizable at higher budgets, but diverged sharply as the budget shrank. Humans and AI systems simplify drawings in fundamentally different ways once resources get scarce.
12. Reading a graph is not one single skill. It involves perception, knowing where to look, mapping that visual information onto the actual question being asked, and then translating that mapping into an answer. Each of these steps can independently break down, and people fail for very different underlying reasons even when they land on the same wrong answer.
13. When tested directly against humans on graph reading tasks, leading multimodal AI models, including GPT-4V, showed a meaningful performance gap. Even when a model's overall accuracy approached human levels, its pattern of mistakes looked nothing like how humans actually get things wrong.
14. People choose entirely different types of charts depending on what specific question they are trying to answer, not out of a generic preference for bar charts or scatter plots. Their chart choices closely tracked which visualization would genuinely help someone answer that specific question correctly.
15. Two of the most widely used graph literacy tests in education research turned out to correlate strongly with each other, suggesting they measure overlapping skills. But when researchers dug into the actual error patterns, the standard categories used in textbooks, like "find the maximum" or "identify a cluster," failed to explain why people got things wrong nearly as well as a more basic, underlying four-factor model did.
16. The deepest goal behind all of this research is not just academic curiosity. It is to eventually help students and everyday people develop genuine literacy with the visual tools that science and modern decision-making increasingly depend on, because every generation should be able to see further than the last by standing on the visual tools the previous generation built.
Follow @yasminekho for more ideas on thinking better, becoming clearer & building a more intentional life.
Elon's AI won.
0:00 - Your digital stripper
1:56 - Grok beat Claude.
4:34 - The Doom Trolling Needs to Stop
8:22 - A face only a mother could love
10:45 - AAA gaming is dying
🇷🇴 The Pavăl brothers (Dedeman owners) bought Carrefour Romania for €823 million.
All tomatoes, eggplants, cherries and other seasonal fruits & vegetables will now come exclusively from Romanian farmers.
🚨Graham Hancock: Humanity a Species with Amnesia
Graham Hancock claims that our accepted timeline of civilization maybe missing a major chapter. Not a modern industrial society with phones and rockets, but an earlier, highly organized culture with knowledge of astronomy, navigation, myth, memory and of course catastrophe.
In this clip I cobbled together from 'The Diary of a CEO', he discusses the ancient flood myths from around the world stating that they might not be superstition, but distorted memories of a real global trauma. He points to the Younger Dryas period, the possibility of a comet fragment bombardment around 12,800 years ago, and the sudden emergence of sophisticated sites like Gobekli Tepe as reasons to keep asking questions about our past.
Whether you agree with Hancock or not, the question is worth definitely worth asking because if humans have been anatomically modern for hundreds of thousands of years, why does civilization only become visible so recently?
Maybe we are not looking at the beginning of the human story, we could be looking at the restart.
Wishing Graham all the best for his upcoming op.
#AncientCivilization #LostCivilization #YoungerDryas #GraemeHancock #AncientHistory #HumanOrigins #GobekliTepe #Archaeology #Cataclysm #HiddenHistory @StevenBartlett@Graham__Hancock
Source:
https://t.co/2FQUFCyRL4
I made a personal black hole that makes you take breaks 🕳️
A shader for Ghostty that spawns a small black hole in your terminal - it drifts around, gravitationally lensing your text. The longer you work without stopping, the bigger it gets, until it's basically demanding you go touch grass
Take a break and it quietly shrinks away
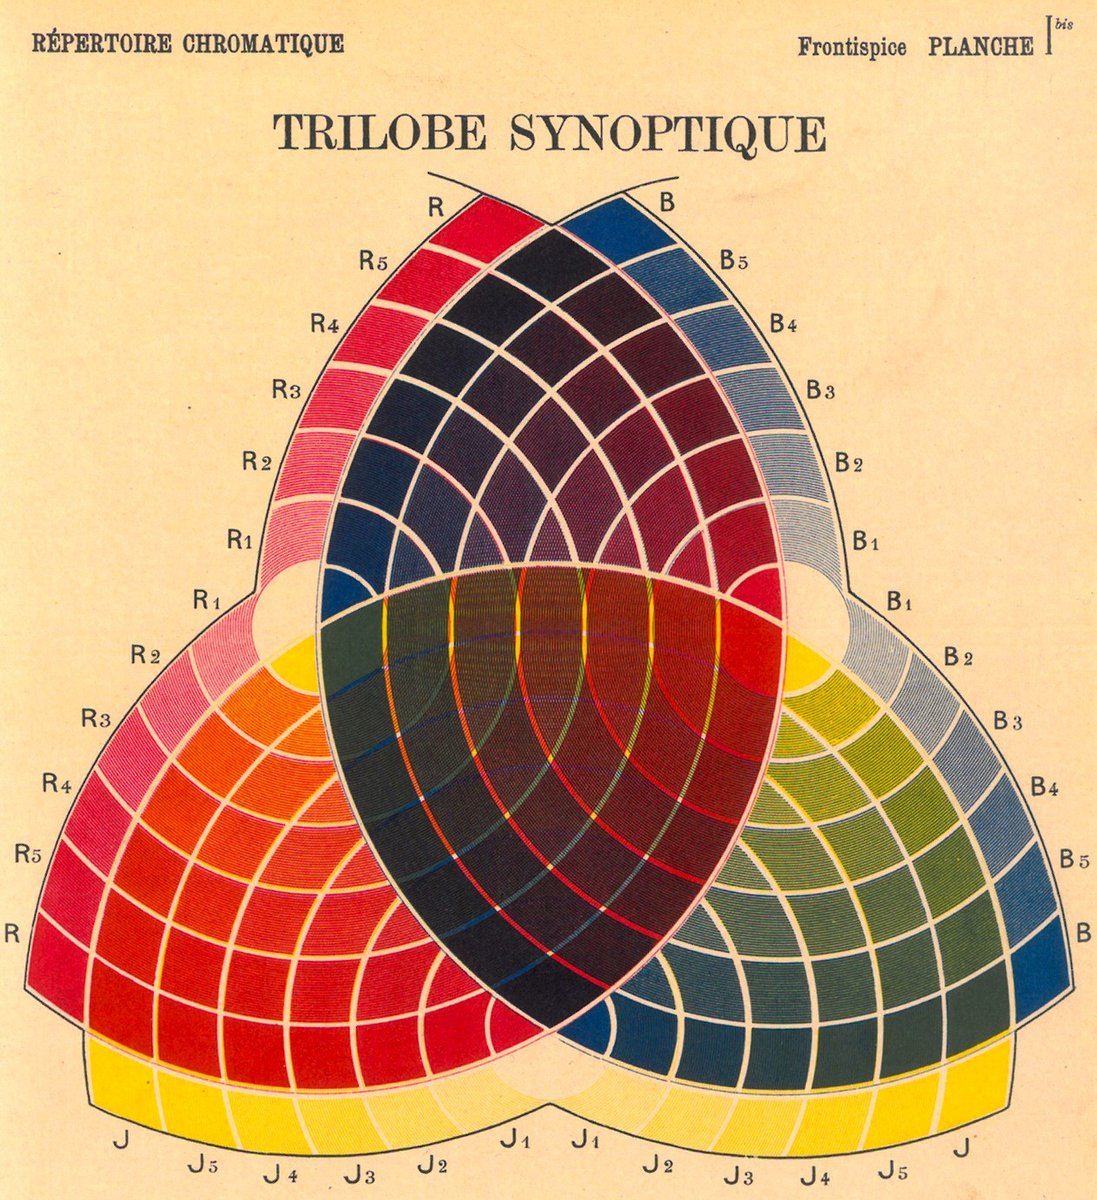
Charles Lacouture, Trilobe Synoptique (1890).
Created before the modern RGB color model, the diagram attempts to map all colors through combinations of red, yellow, and blue, reflecting 19th CE theories of pigment mixing and color harmony.
Chromolithograph on paper.
🇯🇵🇷🇴 Japanese professor Shingo Suzuki brought Romanian language to Japanese universities.
He published the first Romanian textbook in Japan and translated Eminescu’s “Luceafărul”.
Named Honorary Citizen of Iași.
George Hurst, Colour (1900).
Hurst was a Scottish chemist, dye expert, and color theorist.
Looking back, many of these diagrams feel unexpectedly modern. Looking forward, they helped establish some of the foundations on which 20th CE color theory would be built.
1 of 2 👇