Cycles & turning points in stocks, bonds, FX & commodities by M. Riesner (GMCP), Europe's #1 technical analyst 9 years running. Collab with arvy @ThierryBorgeat
WHAT IF the biggest bubble of our lifetime isn't crypto?
Not AI stocks.
Not real estate.
What if it's the one asset every pension fund, every retiree, every "safe" portfolio is loaded with?
Bonds.
Strategically, India trades in an intact secular bull trend and has failed at its 2024 top, which suggests the risk of our favored wave C correction scenario into H2 2026 before starting its next lager breakout campaign.
Tactically, with the February/March reversal, the failure at its 2024 top and breaking its 2022 bull trend, we see the NIFTY trading in a larger corrective pattern and strongly underperforming. Said that, with another tactical down leg into Q4, we would see the NIFTY completing our suggested larger A-B-C correction pattern so where investors we recommend buying into Q4 weakness !!
Look at the long-term picture.
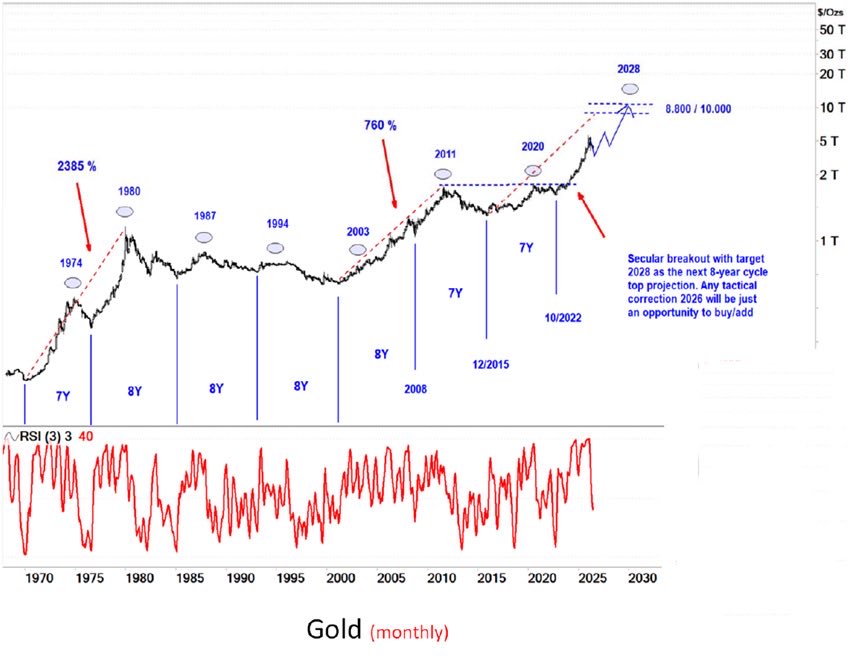
Gold moves in long cycles, roughly seven to eight years between major turning points. 1974. 1980. 1987. 1994. 2003. 2011. 2020. The rhythm is almost metronomic. The October 2022 low looks like the start of the current 8-year cycle, and the break above the 2020 all-time high confirmed it.
If the pattern holds, this cycle points toward a peak around 2028, and a target most people would call insane today: $8,000 to $10,000 an ounce.
The ancients understood this rhythm better than we do.
Genesis 41. Pharaoh dreams of seven fat cows devoured by seven lean ones. Joseph reads it plainly: seven years of abundance, then seven years of famine. His advice during the good years? Store real wealth. Grain. Hard assets. Something that holds value when the paper promises fail.
Four thousand years later, the lesson hasn't changed. Only the asset has.
And the structural case has rarely been stronger:
– Central banks are buying gold at the fastest pace in over half a century, swapping dollars for metal
– Global debt sits at record highs with no plan to repay it, only to inflate it away
– The largest equity supply shock in history is draining liquidity from everything at once
– Every government on earth shares the same quiet incentive: debase the currency, never default
Gold doesn't yield anything. It doesn't innovate. It just sits there, refusing to be printed.
In a world about to print trillions to absorb the IPO wave and service the debt, that isn't a weakness.
It's the entire point.
The sell-off is the dip.
The dip, in this cycle, is a gift.
Store the grain while the cows are still fat.
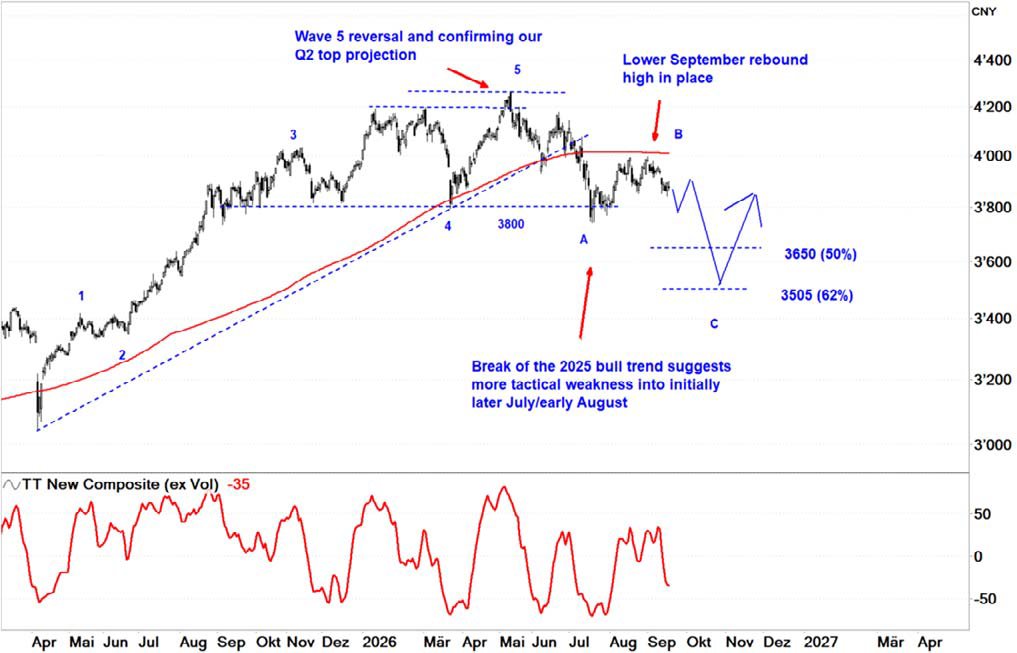
China keeps tracking Japan’s post-bubble analog:
Q2 2026 top ✅
H2 2026 correction 🔄
New highs into 2027 ⏳
Shanghai targets into Q4: 3650 (50%), 3505 (62%).
We’d be buying that weakness, not selling it. 🇨🇳
Global rates are plunging as the AI bubble starts popping.
Investors are desperately fleeing into government bonds in search of safety...
But they don't seem to understand what happens when the AI bubble bursts.
The AI boom has been propping up GDP growth, tax receipts, and financial markets.
Without it, economic growth slows, tax revenues fall, and deficits explode even further.
And if the economy enters a recession, governments and central banks will respond the only way they know how...
More debt, more deficits, and more money printing.
In other words, investors are fleeing into the very assets that governments will have to devalue to keep the system afloat.
We don't own enough gold for what's coming.
15 Charts Every Investor Should Know
15 charts told as one story. Why invest at all, what the ride feels like, how to win it, and the one edge money can’t buy. Plus a book for the kids (and you) and a movie for a rainy weekend.
Read here: https://t.co/yHUTOOS6TR
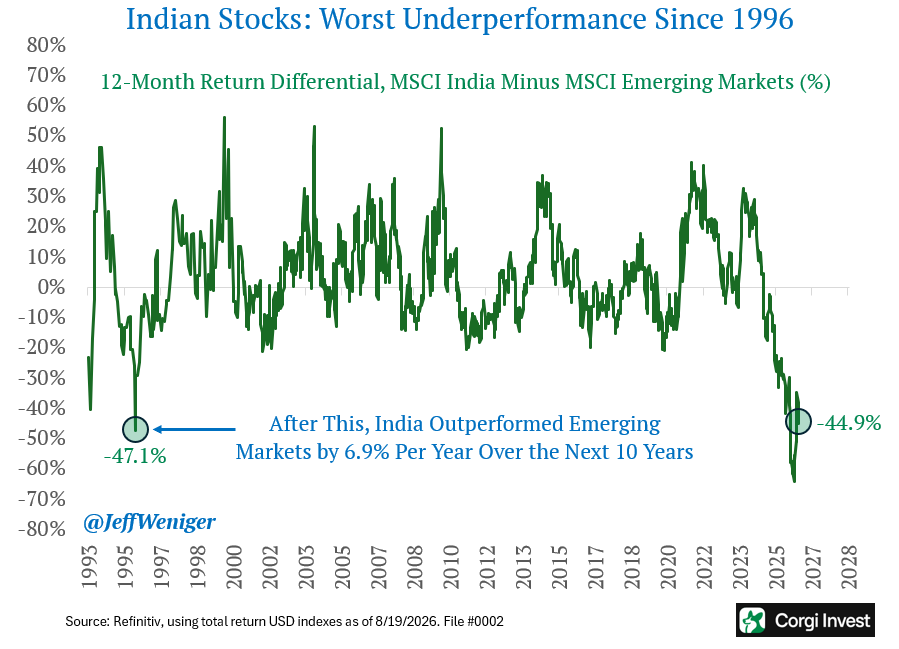
India vs Emerging Markets, 12-month return gap: −45%.
The last time it was this bad: 1996 (−47%).
What followed: India outperformed EM by ~7% a year for 10 years.
One more leg down into Q4 and we’re buyers. 🇮🇳
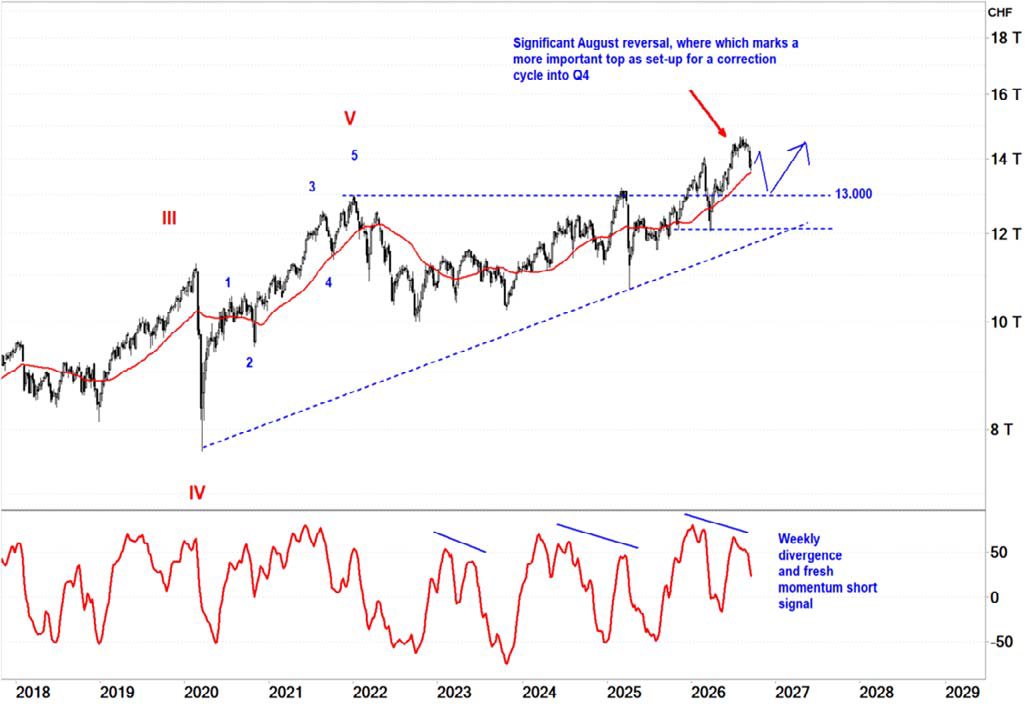
The SMI’s June breakout was carried by Novartis and UBS.
Both have now reversed hard. Roche and Nestlé still disappoint.
Fresh weekly short signal on the SMI.
Don’t chase. Use strength to take profits. 🇨🇭
Everyone is watching AI, crypto and the next equity bubble.
The bigger story may be hiding inside the asset still labelled “safe”.
The 1981–2020 collapse in yields was not just a bond bull market. It was the discount-rate regime in which passive investing, long-duration growth, serial acquisition models and the modern 60/40 portfolio came of age.
Most investors have never managed money in a rising rate world.
Their entire career happened inside the bull.
The unwind has barely started.
And no one is talking about it.
This is the price of time, the return of inflation, the danger of extrapolating yesterday’s winners — and why a harder market could be a much better one for stock pickers.
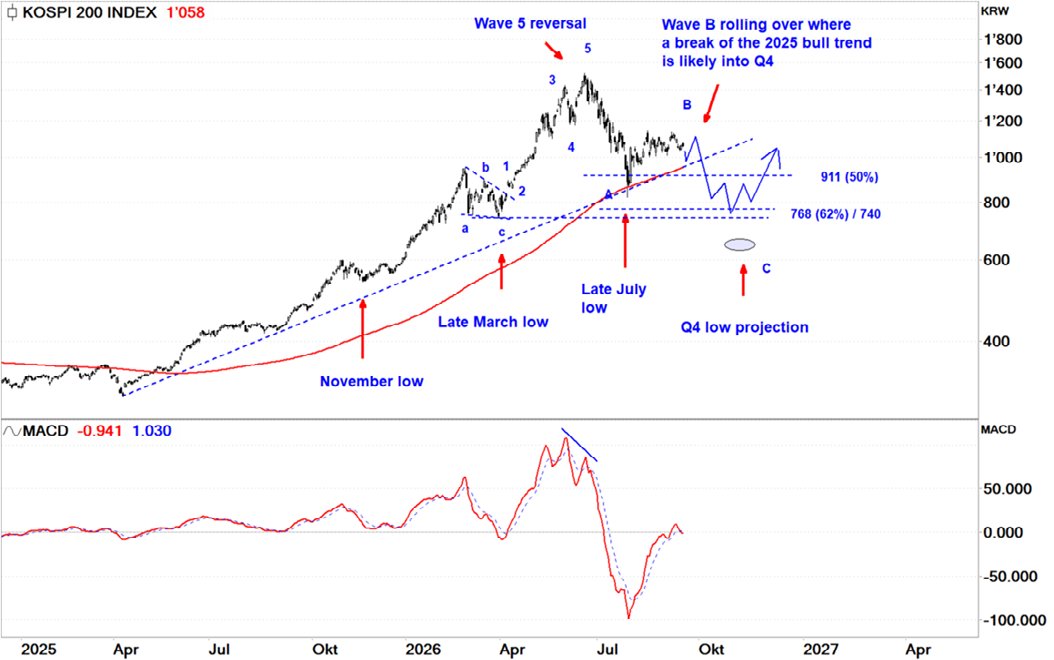
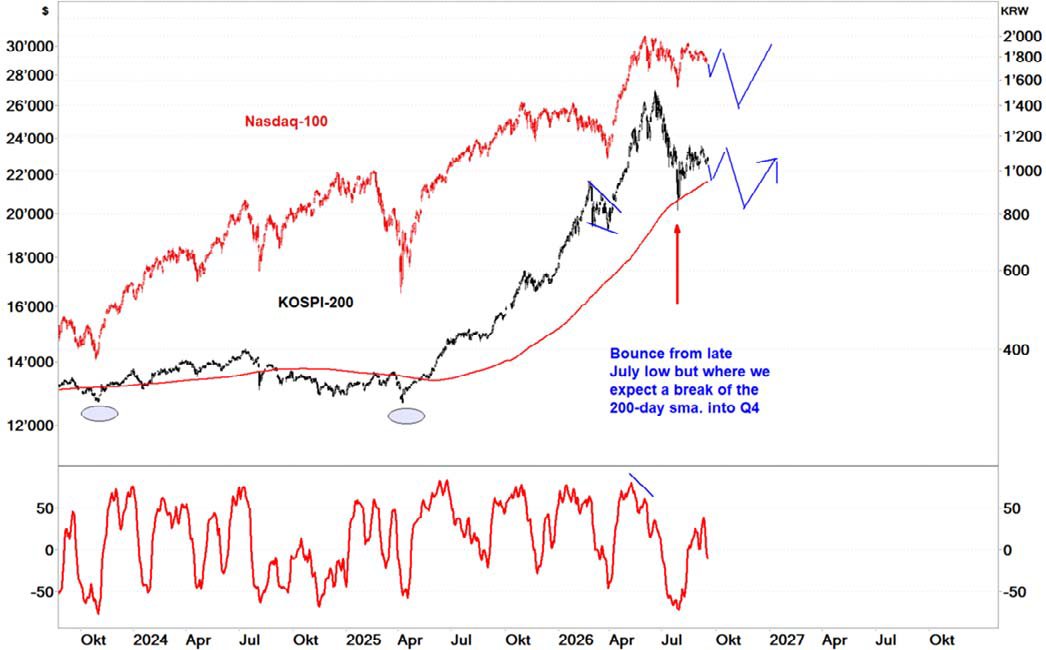
Tactically, after the June/early July reversal we saw the suggested sharp correction cycle into our late July low projection from where we expected a significant wave B bounce candidates into late early September.
On tack with our roadmap, we see wave B topping and rolling over into wave C decline where we see the risk of a break of the 2025 bull trend which would imply an undershooting towards 768 into our Q4 low projection.
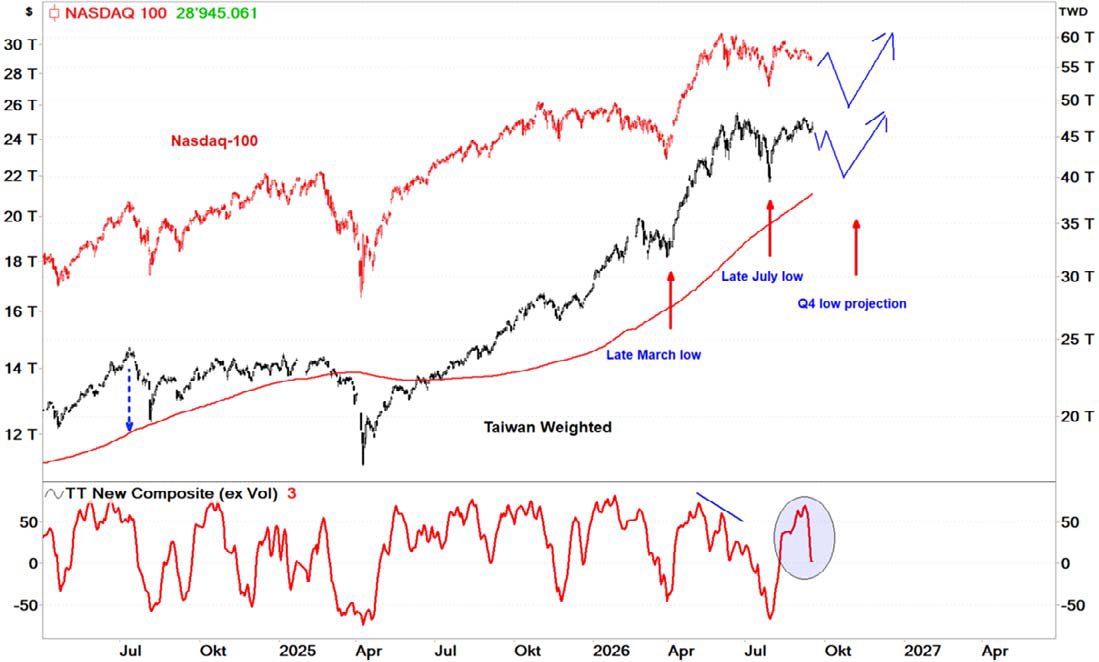
Correlation between Nasdaq 100 and Taiwan Weighted Index and KOSPI-200
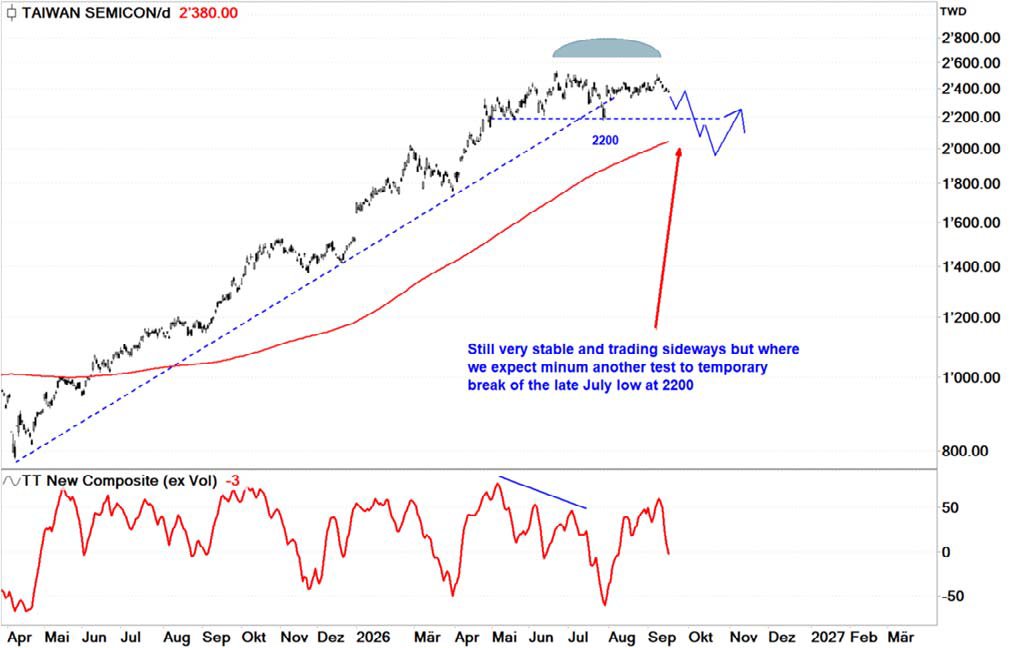
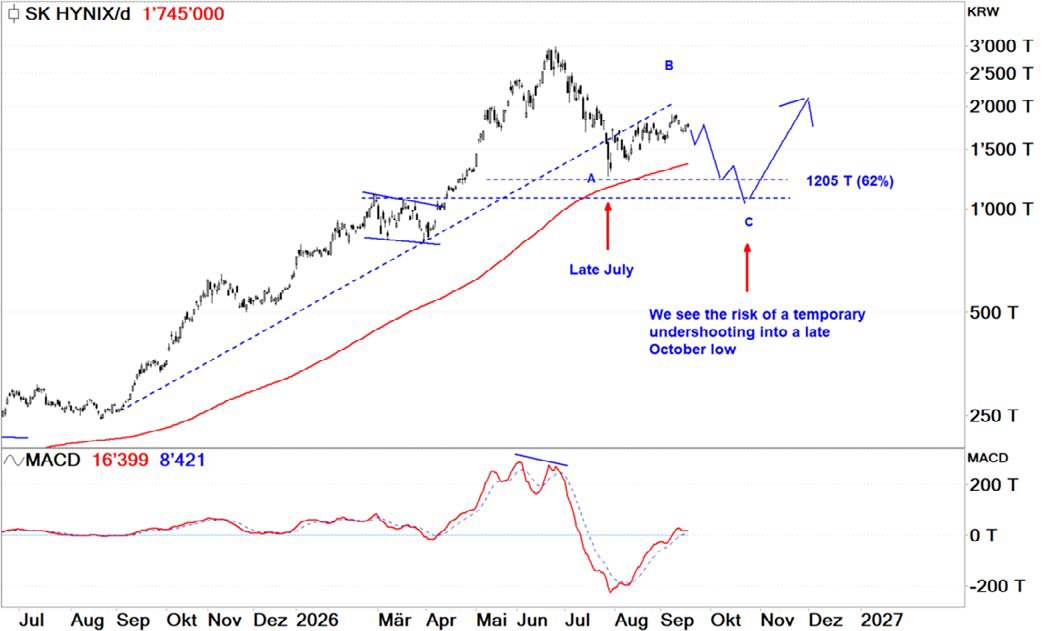
Tactically, after the aggressive overshooting of AI boom markets/themes we saw our suggested June reversal which was the trigger for a sharp correction cycle (wave A) into our late July low as set-up for a wave B bounce into early September and where we still expect wave C developing into Q4.