3⃣ How I use "the big three" to determine major market trends
The "big three" - dollar, yields and oil - are very important.
All three are major drivers of whether general global market conditions are "risk-off" or "risk-on".
Here's what I'm thinking about currently...
This week we saw a hotter than expected CPI and a hotter than expected PPI.
US 10-year Treasury yields initially shot up following the hot CPI print yesterday.
This is a bit of a worry, if it's the start of a new up leg for yields.
But I don't think it is the start of a new up leg.
3⃣ The "big three"
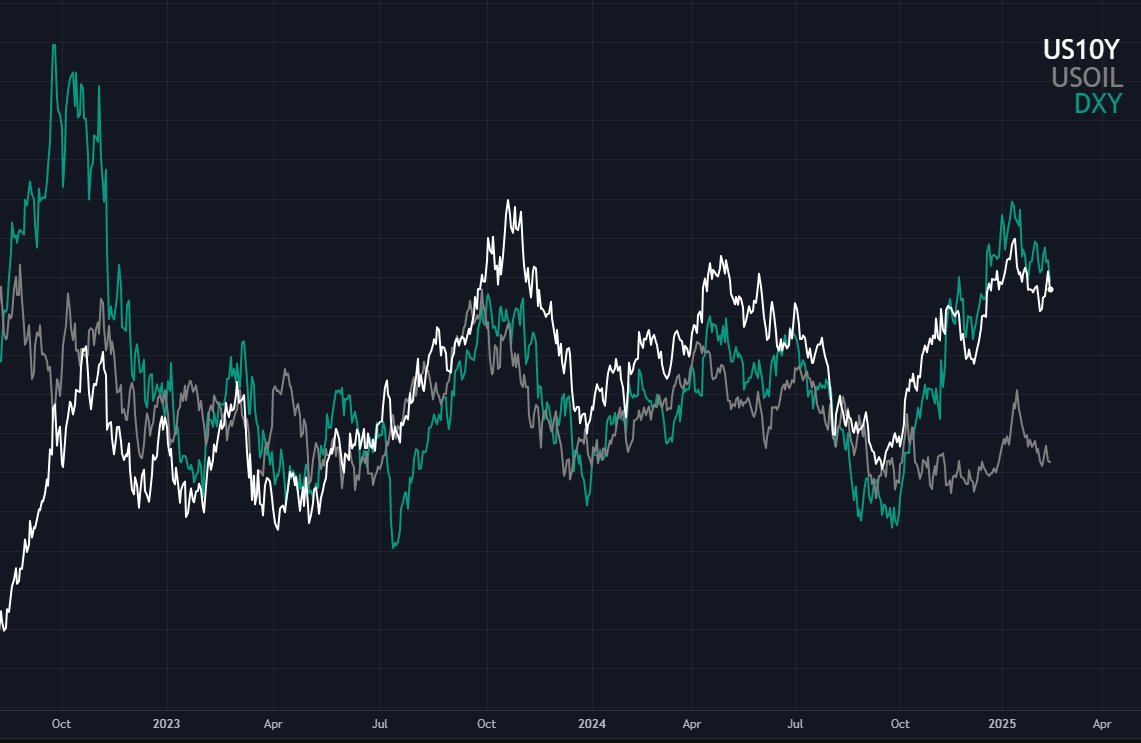
The US dollar (DXY), yields (US10Y) and oil (USOIL) generally follow each other up and down on medium-term timeframes.
This can generally be viewed simplistically as down = risk-on, and up = risk-off, but it's not perfect and can be delayed.
The big question is always: which ones are leading and which ones are lagging.
The answer to this question can change over time.
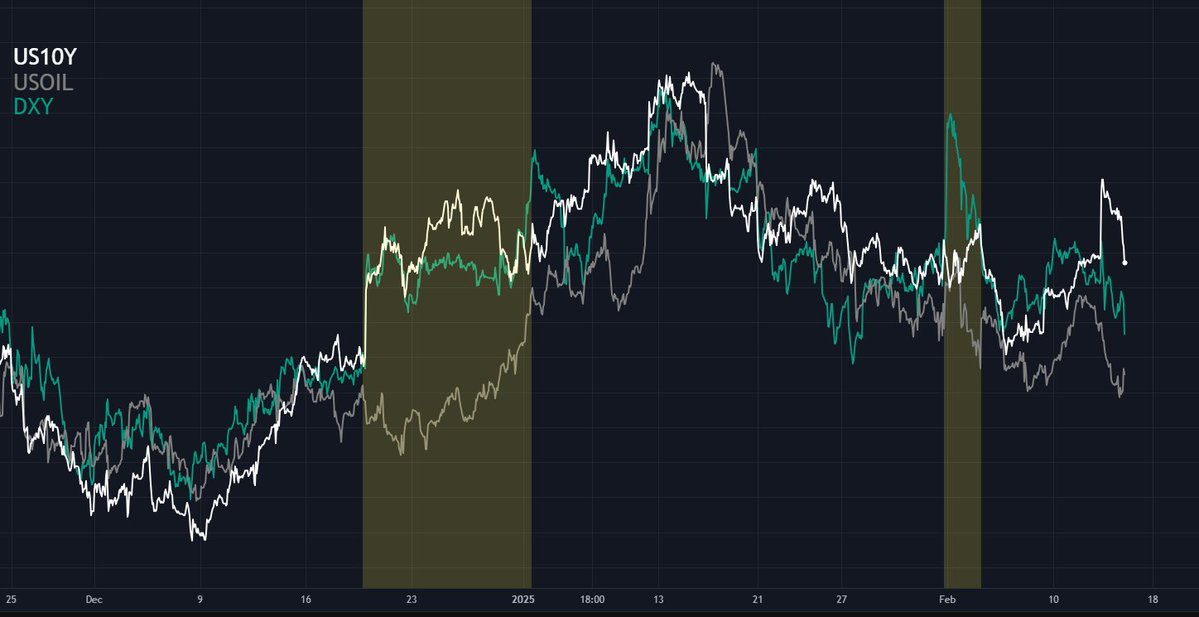
On short-term timeframes, you tend to find that if one of the three gets "out of line", the other two generally drag it back into correlation.
We saw this in December, when oil got "out of line", and in early February, when DXY got "out of line".
This appears to be happening again with US10Y "out of line".
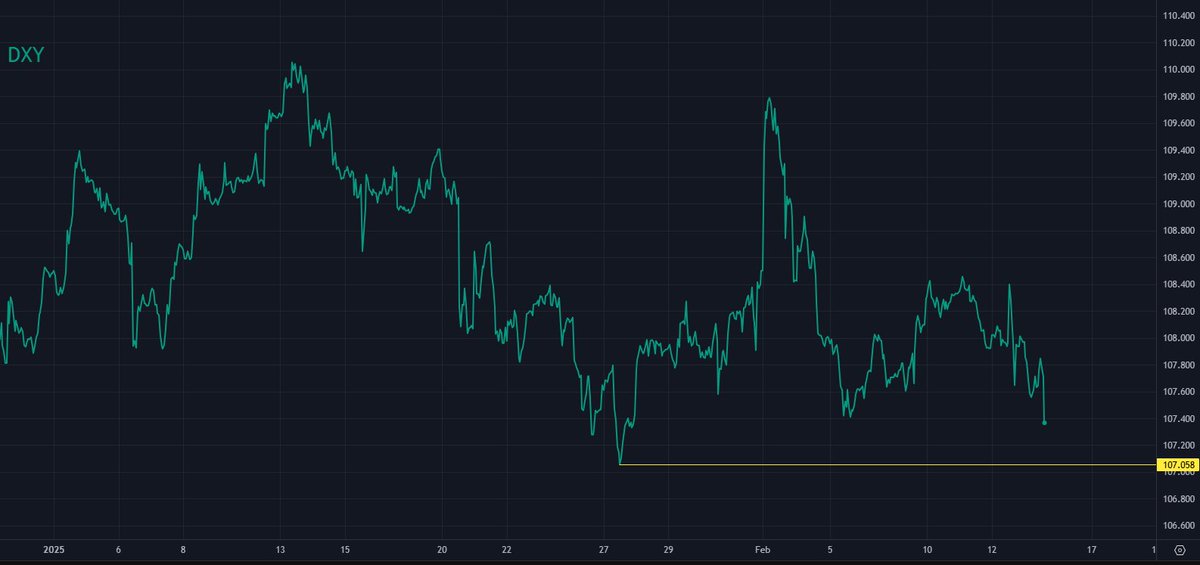
Since mid-January, I've been saying I think DXY has probably topped.
This is still my base case - and this is really the foundation for pretty much every other market.
From my point of view, US10Y freaked out a little bit too much after the hot CPI on Wednesday.
DXY and oil are generally still trending down, which should help to drag US10Y back down, all else being equal.
My overall stance is that we are in the early stages of a medium-term downtrend for the "big three" that started in mid-January.
Laggards among the "big three" are now being dragged down, instead of being dragged up.
Positioning in the dollar is still at historically extreme levels.
I think this is mostly due to tariff fears, but also due to global rate differentials.
Yesterday's CPI print pushed market pricing of Fed rate cuts in 2025 to just one.
I still think tariff fears are overblown, and I think it is also very possible the Fed will cut more than the market expects in 2025.
There is still no real sign of dollar long positions being unwound yet.
When (if) DXY breaks past its prior low, forming a new "lower low", this could lead to a cascade of dollar long positions being unwound.
When (if) this cascade occurs, I do not want to be under-allocated to risk assets.
We are likely to see a rapid injection of hundreds of billions in dollar liquidity entering markets between mid/late February and early April.
This is due to the dynamics around the debt ceiling and the Treasury General Account (TGA).
This is a headwind for DXY.
You can see this general loose correlation in the following chart - showing Net Federal Reserve Liquidity and DXY (inverted).
Due to the upcoming TGA dynamics, we are likely to see Net Federal Reserve Liquidity rise quite a bit, which, if the loose correlation holds, should see DXY falling.
Here are updated probability that #ChatGPT has for #corn yields after today’s crop conditions with latest weather models inputted. Last week it had 170-175 at less then 5%
Subscribe to https://t.co/woCRoIdd7z to get more #corn predictions updates from AI