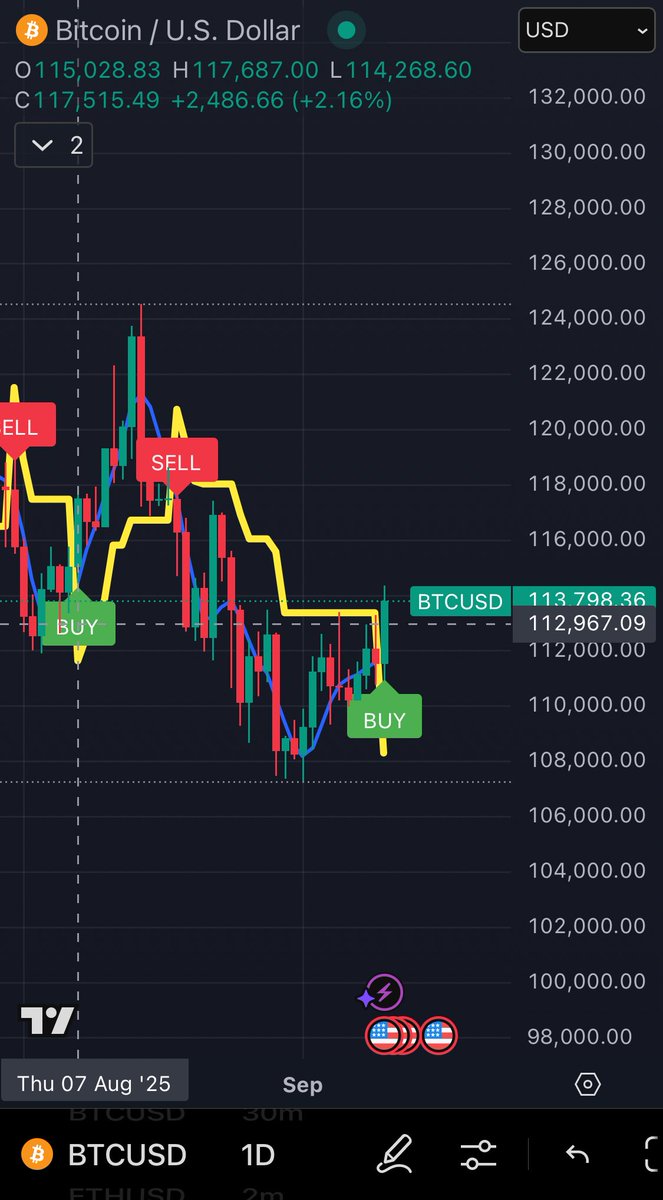
BItcoin currently in a nice uptrend.
Next target is $135,000, which is the 1.618 FIB line.
Any retests of the 20 day EMA from here to there are likely long opportunities.
Trade BTC and all top coins now on Bitunix (available everywhere) 30% FEE DISCOUNT and $400 Deposit Bonus & $8000 Trading Bonus 👉 https://t.co/MDONpfOS4l
#Bitcoin is just hitting the lowest Monthly volatility ever as we speak in September 2025
Below are the examples of what happened each time such thing occured
So far 3 times & each resulted in massive upside both % but mainly time wise. Will this time be any different?
I gave you the sell signal before the drop and the buy signal before the rally, free and transparent because I know how powerful the CrossX indicator is.
Now $BTC is bouncing off the gray cloud and targeting $130K, while altcoins flash bullish signals. This bull run will be bigger than you expect.
Use the CrossX indicator to catch altcoins before they rally and trade with greater accuracy. 👉 Get access here: https://t.co/LtbP95qrYg
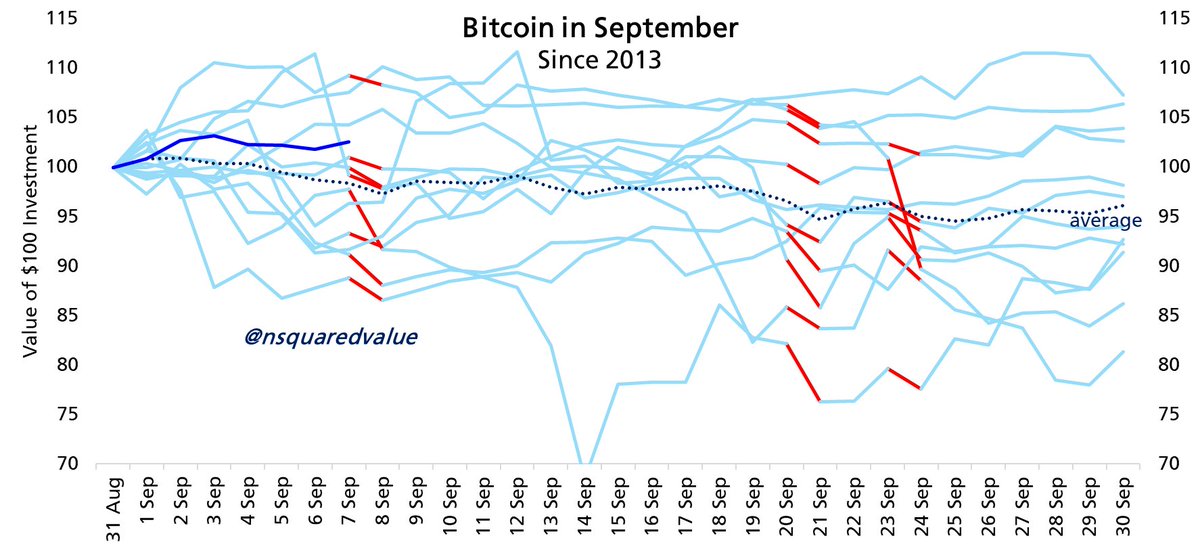
Tomorrow is September 8th. Why is that important for Bitcoin?
September 8th is consistently one of the worst days of the year for Bitcoin performance.
On any given day, Bitcoin is up 53% of the time for typical gain of +0.10%.
September 8th is down 72% of the time for a typical loss of -1.30%. This makes it the 7th worst day of the year.
But interestingly September 8th is highly predictive for the entire month's performance. When the 8th is positive, Bitcoin has a positive month 75% of the time. When the 8th is negative, September is down 90% of the time.
$BTC | Massive Cycles Update
I’ve made some bold claims and predictions recently, and today I want to walk through the reasoning behind them. However, its important to note that successful trading is about adaptability, shaping ideas, assessing odds, and letting the market itself decide which paths are valid, while knowing that conviction must always leave room for flexibility.
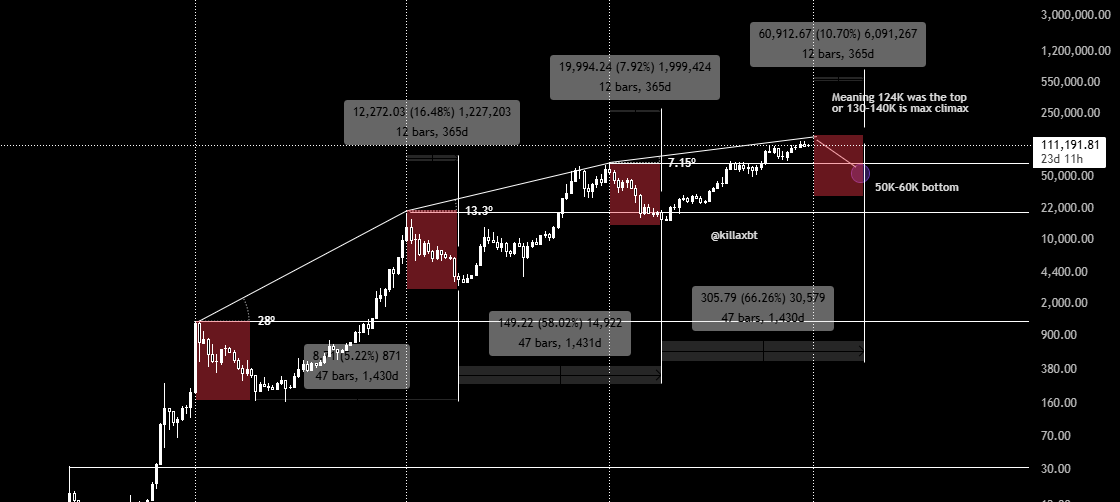
Right now, I am leaning toward the idea that the cycle top is either already in, or very close to forming. I recognize this is a bold statement and expect people to disagree with me.
To be clear, I am not trying to pinpoint the exact top to the day. My focus is on protecting capital and identifying the broader window in which risk is elevated. If my timing is off by a few months, or if BTC pushes toward 130–140K before rolling over below 70K, that does not invalidate the thesis. The goal is to avoid buying long-term bags into exhaustion trying to catch the last 10-15%.
My track record of HTF predictions has been strong, but I am not here to boast... I am here to present my analysis.
Halving Cycles and Timing
Cycle 1: Topped 360 days post-halving
Cycle 2: Topped 518 days post-halving
Cycle 3: Topped 546 days post-halving
We are currently 497 days post-halving. If BTC follows the same rhythm, a top within the next two months would align with historical behavior. However, there is an important caveat: BTC already printed a new ATH pre-halving, something we’ve never seen in previous cycles. The ETF approval likely pulled demand forward, creating the possibility of a shorter cycle than the past three.
Bullish Confluences
• Historically, post-halving cycles have been lengthening. That would imply BTC still has time left before topping.
• Over $6B in USDT was printed in a week, signaling liquidity inflows.
• Rate cuts are typically seen as bullish for risk assets, even if past data shows mixed outcomes.
• Liquidity clusters remain above around 124–130K, which could act as a magnet.
Bearish Confluences
• BTC has printed a clear exhaustion gap, something that in past cycles has signaled a trend shift. In this cycle, the last time we formed a exhaustion gap at 98K... It resulted in a trend shift & push down to 74K. However, as seen from my examples in 2021, BTC formed 2 gaps. Both with similar characteristics & both exhaustion gaps. Shortly after... BTC pushed down 30-40%.
• Diminishing returns suggest BTC is nearing its peak, as each cycle delivers lower percentage gains than the last.
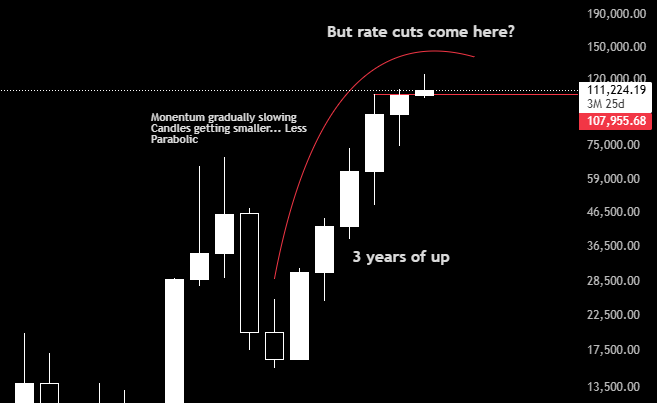
• The monthly chart has now printed six straight green candles, but bodies and wicks are shrinking - a classic sign of slowing momentum.
• Price is grinding higher on declining volume, while bearish divergences appear across multiple timeframes.
Scenarios Around Rate Cuts
The real wildcard is the market’s reaction to upcoming rate cuts. Since expectations are already priced in, I am observing two plausible scenarios:
Bullish Continuation: BTC dips into the announcement (bearish narrative) but reverses quickly on lower timeframes. This could trigger a final euphoric leg higher, aligning with extended post-halving timing and a top in the October–November window.
Or
Exhaustion Top: BTC initially reacts bullishly, but liquidity injections act as exit liquidity for larger players. In this case, rate cuts could ironically mark the catalyst for the cycle peak.
At present, the crowd leans heavily toward a bullish reaction. That positioning itself makes me cautious. A failure to reclaim levels above the exhaustion gap would support the broader correction thesis, with a possible move toward 100K.
Broader Outlook
I remain bearish on the high-timeframe trend. Since 2022 I’ve been consistently bullish and publicly called the cycle bottom in my discord, but this is not the moment to get caught up in hopium. Tops are not meant to be easy to time, and it is far more important to protect capital than chase fantasies of “this cycle is different.”
The ETF narrative is often misunderstood. BlackRock is not buying BTC directly... their clients are buying through the ETF, and BlackRock is collecting commissions. That is retail demand, not institutional conviction.
The only unique factor that could alter the cycle dynamics is miner economics. With costs above 90K, many miners are operating at a loss. If BTC fails to keep pace with rising mining costs, rigs may shut down, which would reduce miner selling pressure.
Beyond that, the math and historical structure of cycles remain intact, leaving little reason to believe this cycle will diverge significantly.
Conclusion
The cycle is in its late stages. At best, there may be a few months of upside left, but the evidence leans toward caution. Whether BTC tops slightly higher or has already peaked, the math suggests we are much closer to the end than the beginning. Protecting capital should now be the priority. If I happen to be wrong on the local LTF so be it. But in a year from now, people will look back an realize just how right I was.
$BTC
Why this cycle still tracking the 2017 cycle closer, not the 2021 cycle, and what it means going further
If you still don't believe me as to how this cycle is closer to the 2017 than the 2021 cycle, a theory we identified the first in March 2021, at 21.5k, when all of our cycle bottom indications turned green, here is another perspective + a short comment as to what it means going forward.
Because I still hear so many comparisons of "double top cycle incoming", "$BTC will top under 140k", "$BTC.D will make a second high above 65%", "Red September during the final cycle year", etc etc etc.
Those are all reflections and comparisons drawn from the 2021 cycle, wrongly in my humble opinion.
Playing devil's advocate. Let's assume this cycle indeed was like 2021, then for example based on the super trend indicator, the one I exploited a lot back in 2017 and several times this cycle already, buying every time the green line touches, or gets very close, would only have given one successful buy-in if you were to hold for at least half a year (investment timeframe), and one terrible buy-in. That's a 50% win rate.
Compare that to using it in 2017, within my criteria, would give 5 out of 6 successful buy-ins, i.e. an 83% hit rate, using only 1 indicator.
And that is another piece that goes into my baseline analysis and explains why it achieves a high success rate.
To not use any indicator or fractal or repetition blindly, especially for simple indicators. If you want to use simplified models and indicators, it becomes more important to identify the type of environment first, do analysis on that, before assuming a simple indicator is expected to work. 'The advanced work needs to be put in at some point'. (No free lunch principle).
And then if you really want to be ahead and get even closer to my method, you can do "advanced analysis" on how the cycle will play out, and then use cookie-cutter indicators (like the wave trend), but also more robust custom advanced ones + price action analysis + all the other tools I use on top to boost hit rate even more. And then, you get really close to my hit rate whilst avoiding paralysis by analysis through a structured approach. But you don't get a high hit rate by blindly and arbitrarily following "the previous cycle"
So to conclude, $BTC.D won't act like it did in 2021 in this cycle, alts won't do a fast catch-up on the grand scale like they did in 2021, but a slower and later one like they did in 2017. The same has been so far and still is true for $ETH, and the same will be true for all the sub-crypto classes going further.
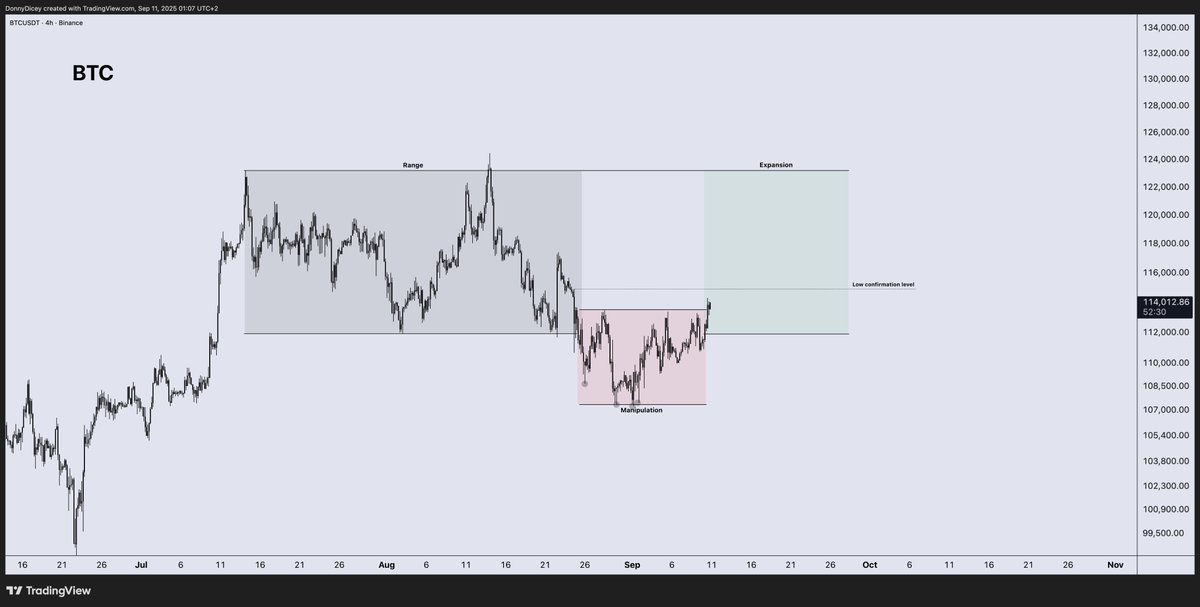
$BTC - Some further confluence on the notes in chart.
More likely scenario - H4 EMA 100,200 (Green) trend broken and acting as resistance. D1 EMA 200 (Black) coincides with $105k Liquidity and is solid support.
Bullish scenario - Flip H4 EMA 100,200 trend and market starts looking really good again.
P.S. I posted this chart initially purely of off price action. Then checked EMAs and it was nice confluence.