Look everyone... don't ever be concerned with my positions; be concerned with the risk you are taking.
I've been trading for 43 years and have had only a few single-digit drawdown years. All of my trades are made from very low-risk entry points and always with a hard stop loss in place.
I could turn out to be wrong and the market may have already made its low. If so, I'll get stopped out. That's the business.
I'm wrong just as often as I'm right. The difference is that my risk is always defined and controlled. What matters is not being right all the time; what matters is that the risk taken relative to the potential reward, adjusted for batting average, is managed in a way that produces a profitable outcome over a large sample of trades.
That's how I've approached the market throughout my entire career, and it's no different today. The distribution of gains and losses over time forms a profitable bell curve because risk always comes first, and risk is always managed in relation to reward.
As the market opens higher this morning, it's important to remain disciplined and avoid chasing an early rally—especially following a significant down day and a weak close on Friday.
One of the most common mistakes investors make is assuming that the first bounce marks the start of a sustainable advance. In many cases, the initial rally is simply an oversold reaction or what traders refer to as a "dead cat bounce."
Historically, after a sharp decline, I prefer to give the market time—often until midweek or even the end of the week—to see whether buyers are truly stepping in with conviction. Very often, after the first reaction higher, the market resumes its downtrend, undercuts the recent lows, and additional damage occurs.
Patience and selectivity are critical. Let the market reveal its true character before becoming overly aggressive. Focus on preserving capital, managing risk, and allowing the price action to confirm whether the move is the beginning of something meaningful or merely a temporary bounce within a larger decline. https://t.co/JXzFFTmMtn
The S&P 500 gained 10.7% through the first five months of 2026, putting it on pace for a 15%+ gain for a fourth year in a row. The only other time the benchmark achieved the feat was the five-year streak from 1995-99.
The longer the rally continues, the more it resembles the late-1990s bull. Both were fueled by a revolutionary technology that triggered capex spending and productivity gains.
There are key differences, including demographics, consumer sentiment, and geopolitics, just to name a few.
While the debate over how well the current market fits the 1990s analog is fascinating, the relevant question here is whether the current rally will come to an end.
Two triggers of the 2000 bear market – rising inflation and technical divergences – are in play but not at bull-breaking levels currently.
The S&P 500 roughly followed its midterm year average pattern through February before diverging during the March selloff and April-May rebound (chart). Events in the Middle East likely brought some of the typical midterm year weakness forward.
History suggests additional weakness is possible, especially late in Q3 amid election angst. As the outcome has becomes less uncertain, the market has tended to enter a year-end rally. Point-to-point, the S&P 500 has risen 4.7% in the second half of midterm years, on average, which is the final input into our S&P target.
Given the historically overbought condition of the Technology sector, a Tech-led mean-reversion pullback could align with the midterm pattern however, midterm years often end on a high note.
https://t.co/JXzFFTmMtn
https://t.co/FfBnR93ojq
https://t.co/TFyCpPHZis
Most #traders try to “learn” trading like school.
That’s why they stay stuck. 👇
#Trading is not knowledge first.
It’s experience first.
You don’t become good by reading more.
You become good by doing — and correcting.
Here’s what actually builds a real trader:
1) Repetition
Same setups. Again and again.
Not 10 strategies — one approach you can execute.
2) Market Feedback
Every trade talks to you.
Win or loss — both are information. Most ignore it.
4) Mistake Reduction
You don’t need perfect trades.
You need fewer stupid mistakes over time.
5) Self-Observation
Why did you take the trade?
Why did you exit early?
Write it down. Face it.
6) Time in the Market
Bull phases. Corrections. Chop.
You need to live through all of it. There’s no shortcut.
Trading has rules.
But execution is an art.
And art only comes from experience.
You can get ideas from other traders.
But at some point, you must build your own way.
That’s where most fail.
They stay in theory.
They avoid mistakes.
They never build real conviction.
Here’s the truth:
• You will make mistakes
• You will feel uncomfortable
• You will doubt yourself
Good.
That’s the process.
The only thing that matters:
Are you learning from it?
If you analyze your trades, reduce mistakes, and stay consistent…
You will improve.
Not in weeks.
But over months and years.
That’s how traders are made.
Not taught.
I’ve seen this again and again.
If you are looking for action, go to Vegas. If you want to be a profitable stock trader, you need to love discipline and process more than action and excitement.
STANLEY DRUCKENMILLER: "I SHORTED $200 MILLION OF INTERNET STOCKS IN MARCH 1999. IN THREE WEEKS I COVERED THEM AT A $600 MILLION LOSS."
"I was short 12 stocks. They all went bankrupt. Every one of them."
He was right on every single pick. Still lost $600M.
"If you're dead wrong on a long, you can lose 100%. If you're dead wrong on a short, you can lose 10 times your money."
"Frankly, I'm not sure I've ever made money in shorts. I've never had a down year, but I'm not sure I've made money in shorts. I like it. It's fun. But you can get your head handed to you."
"Don't try that at home."
While skeptics focus on Trump, the Middle East, and oil prices, the S&P 500 just staged a V-shaped recovery to new highs in only 11 days.
After more than 40 years of successful trading, I still don’t rely on gut instinct during turmoil, nor do I rely on analyst opinions, or what merely seems logical. I trust price action, leading stocks, and historical precedent. That—not emotion—drives my decisions. https://t.co/JXzFFTnkiV
“If you’re going to trade using models then you just slavishly use the model. You do whatever it says no matter how smart or dumb you think it is in that moment. And that turned out to be a wonderful decision.”
— Jim Simons
@SJosephBurns One of the best financial decisions I've ever made was to allocate about 20% of my net worth to gold coins in 2023, when the price was around $1,800 to $2,000 per ounce.
Not as an investment, but to protect myself and secure my future.
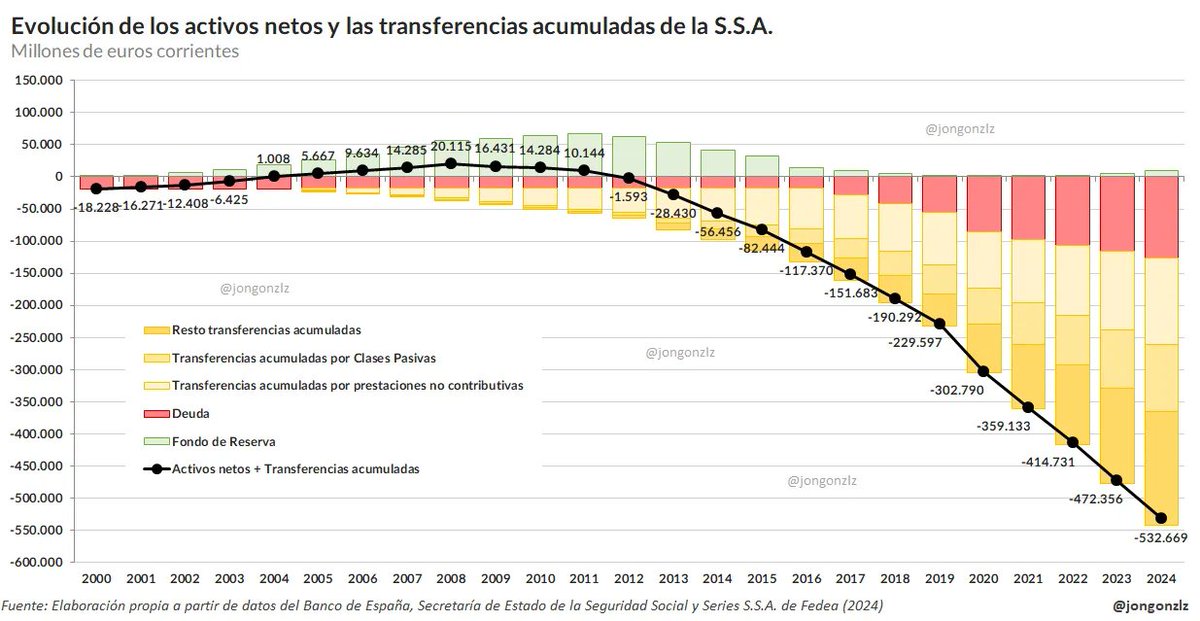
🤦El sistema está quebrado y es deficitario.
Este gráfico de @Jongonzlz es muy aclaratorio.
Da lastima que millones de personas crean que hay una hucha real y el sistema no tiene déficit brutal👇
@ajnogues Cuida ese coche con 98. No hay tanta diferencia de precio (a menos que hagas una kilometrada enorme) y me da que te lo puedes permitir.
Yo para mi nuevo Civic Type R siempre 98
"If a stock is under accumulation, a price consolidation represents a period when strong investors absorb weak traders. Once the "weak hands" have been eliminated, the lack of supply allows the stock to move higher because even a small amount of demand will overwhelm inventory."
— Mark Minervini
@AparicioCadiz Ahora mismo son acciones basura, no tienen por qué ser empresas basura como irónicamente dices
El mercado nunca se equivoca, y efectivamente lo bueno, si vas en largo claro, es lo que sube
Oferta y demanda es lo único q mueve al mercado, y el volumen te dice donde va el big money
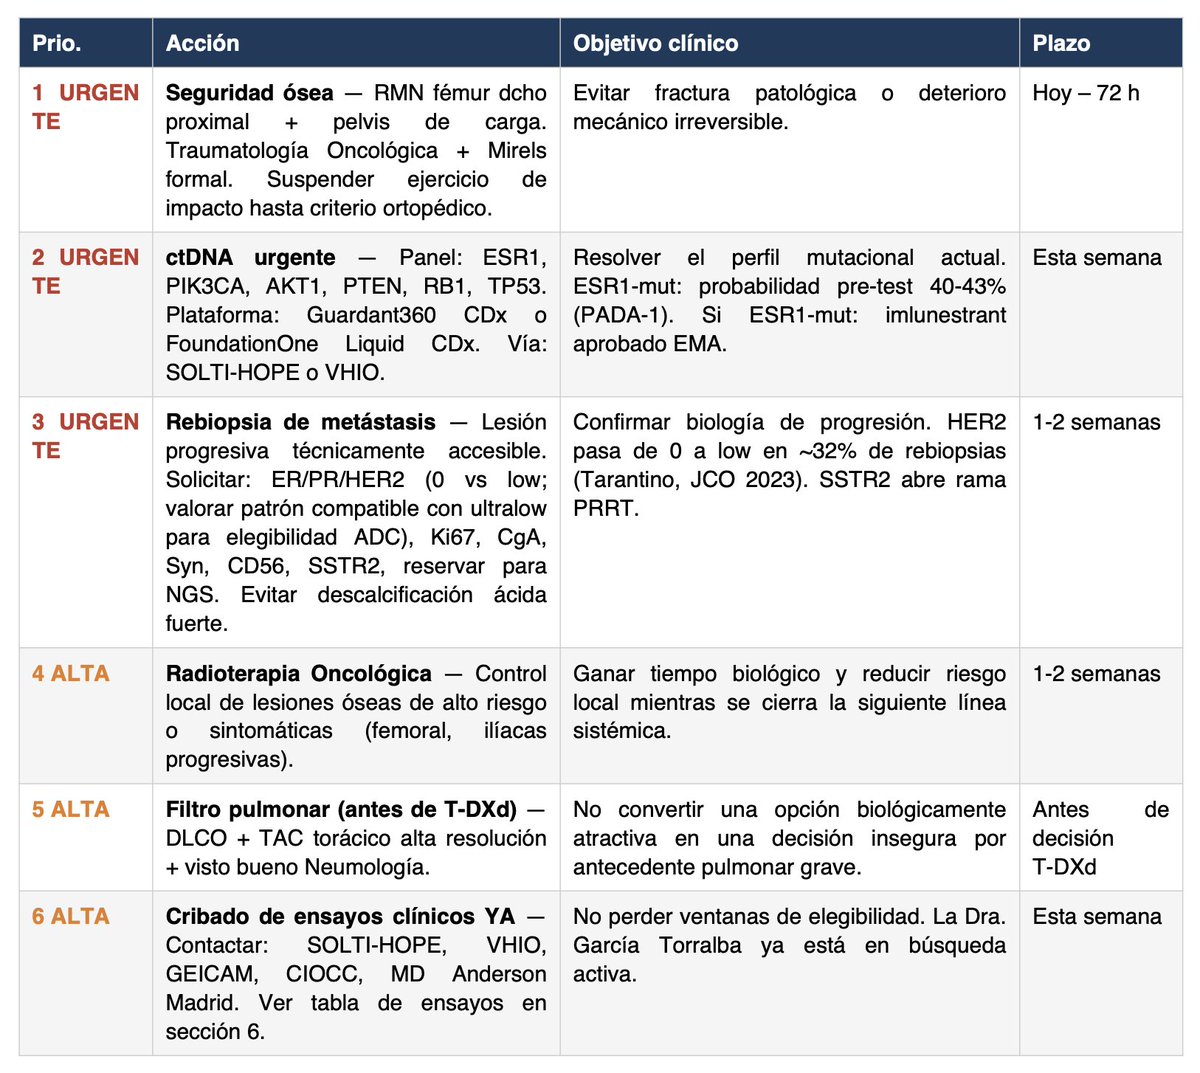
🔴 NECESITO TU ATENCIÓN
Llevo una semana ayudando a Miriam en su caso de cáncer metastásico y quiero compartir la metodología que he estado usando porque es absolutamente replicable.
Pienso que, con suerte, puede ser ÚTIL A OTRAS PERSONAS con cáncer (o con cualquier otra enfermedad).
Los resultados que hemos conseguido no son un milagro, pero pensamos que son realmente útiles y pueden significar una diferencia crucial en un caso médico de vida o muerte.
Aquí va paso a paso el método:
1/ Usar los modelos más avanzados del momento (por desgracia de pago, y no son baratos, opino que Sanidad Pública debería invertir en esto):
- ChatGPT Pro + Extended (40min de pensamiento aprox por llamada)
- Claude Opus 4.6 MAX
Pendientes de probar a fondo:
- Perplexity Sonar Pro
- Notebook LM
2/ Dárselo MUY MASCADO a la IA todo el historial. Esto parece una tontería pero es muy importante.
- Lo primero que pido, con Claude Cowork que tiene acceso al disco duro, es que entre en la carpeta en la que está TODO EL HISTORIAL (pueden ser más de 100 pdfs) y lo unifique todo en:
- Un único PDF (puede ser de más de 1000 páginas o lo que sea necesario)
- Un único txt legible, que debe hacer correctamente usando un script con OCR y luego comprobar con lupa que está bien hecho.
Insisto: no saltar al siguiente paso antes de tener muy bien hecho lo anterior, sobre todo el txt.
3/ Una vez tenemos lo anterior utilizar este prompt junto con el txt y el PDF como archivos de entrada y lanzarlo en AMBOS modelos (y en más si es posible) a la vez.
👉 Os lo dejo aquí, este prompt es increíble complejo/avanzado: https://t.co/KEEWc8WNvW Está pensado para el caso concreto de Miriam, pero con los modelos del punto 1/ podrías adaptarlo a tu caso particular sin problemas.
4/ La PUNTA DE FLECHA enfrentando un modelo al otro: esta metodología no la he escuchado a nadie, pero funciona increíblemente bien. La sensación es la de ir afilando una estaca hasta que adquiere una punta reluciente.
Funciona así: con paciencia y en sucesivas iteraciones (aconsejo mínimo 5 veces, y en en cuenta que si ChatGPT tarda 40min te va a llevar un buen rato) enfrenta el resultado (el PDF) de un modelo a otro. Con un prompt sencillo del estilo:
"Otro comité de expertos opina esto. ¿Cómo lo ves? Si estás de acuerdo o lo contrario dime por qué, y genera un nuevo PDF si lo ves preciso".
El resultado se lo cruzas al modelo contrario. Así, en sucesivas iteraciones, búsquedas de internet, papers, etc. irán encontrando y afilando más cosas.
¿Cuándo acabar? Cuando AMBOS modelos digan que está perfecto y no puedan mejorar más el trabajo del contrario. Esto es tan absurdamente rompedor que pienso que los resultados de TODOS los modelos actuales mejorarían si siguieran esta metodología (apoyándose en una espiral rollo "adversarial model". No entiendo por qué nadie se ha dado cuenta de esto, si lo ha hecho, por qué no se le da más bombo. Funciona impresionantemente bien en cualquier ámbito, inclusive programación y matemáticas.
Es mas, mi teoría es que esto podría hacerse todavía mejor haciéndolo no solo con dos modelos: sino con una mayor combinatoria, añadiendo quizás Perplexity Sonar Pro, etc.
RESULTADOS
Increíbles. Obviamente no puedo saber si mejores que el mejor de los comités científico-sanitarios del mundo, pero le están dando a Miriam una nueva dimensión del caso, tests adicionales que hacer, posibles pruebas, etc.
Obviamente la IA milagros no hace, pero pienso que puede ya, a día de hoy, ayudar a muchos pacientes. Y Sanidad Pública debería invertir mucho, pero mucho, en esto.
Voy a preguntarle a Miriam si puedo poner el PDF completo de resultados más avanzado que conseguimos, para que os hagáis una idea de su calidad. Ya me ha dado más o menos permiso, pero quiero asegurarme 100%.
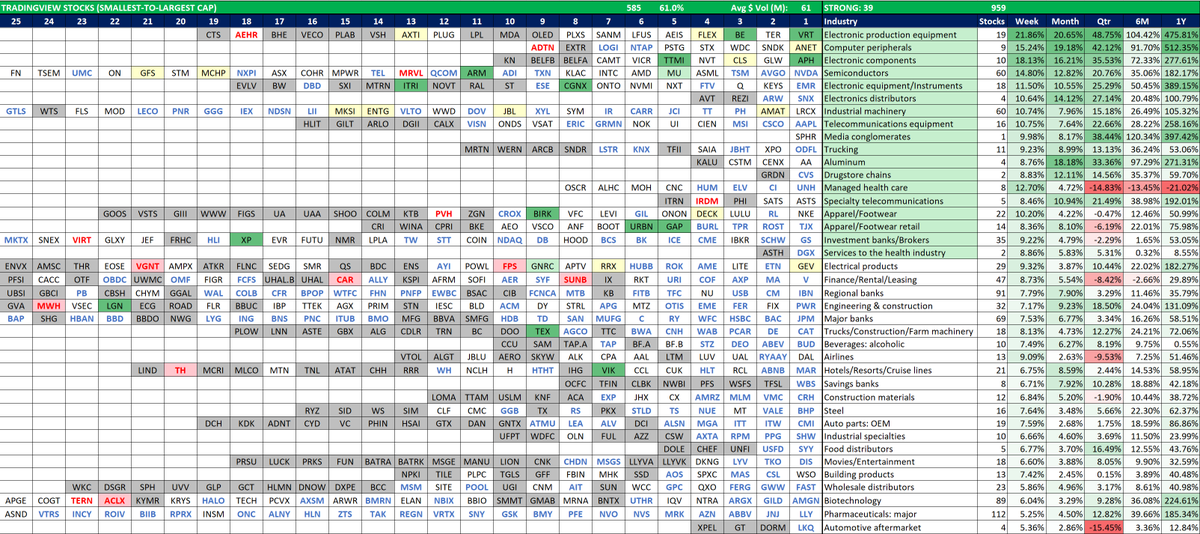
📈Leading Stocks In Leading Industries (TradingView)
The chart shows largest stocks in the strongest industry groups, based on "Week x Month" Relative Strength (RS)
🏭Industries: sorted ⬆️ strongest-weakest ⬇️
Stocks: sorted ⬅️smallest-to-largest ➡️market cap
“You want to own the leading stocks in the leading industry groups.” - William O'Neil
* Daily $ Vol >= $50M