According to this cycle $BTC tops this week, begins to drop next week. 🧐
This chart has two main things one a macro rising channel divided in green and red, and a fibonacci based time cycle.
The #bitcoin enters parabolic rise every time it moves into the green channel zone, in the red zone it moves a bit more sluggish. So far this whole cycle since 2022 $BTC has not been able to move into the green zone -- that's different. Also it's never broken under the red zone since it entered it in 2013.
$BTC Update
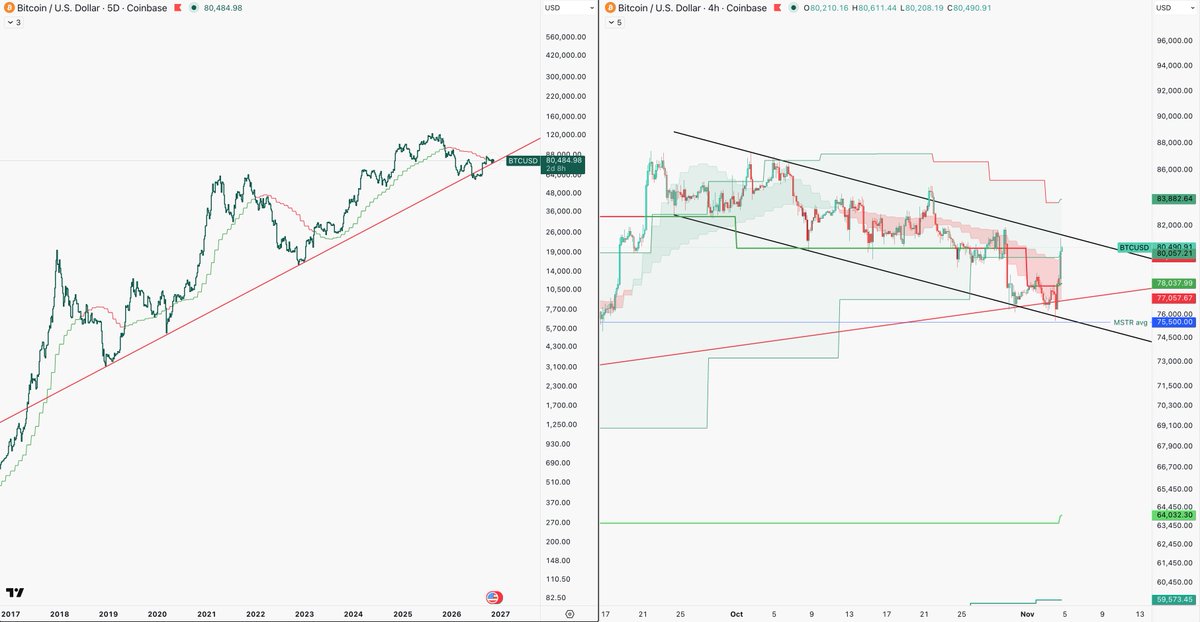
- 75.5k backtested and failed to flip
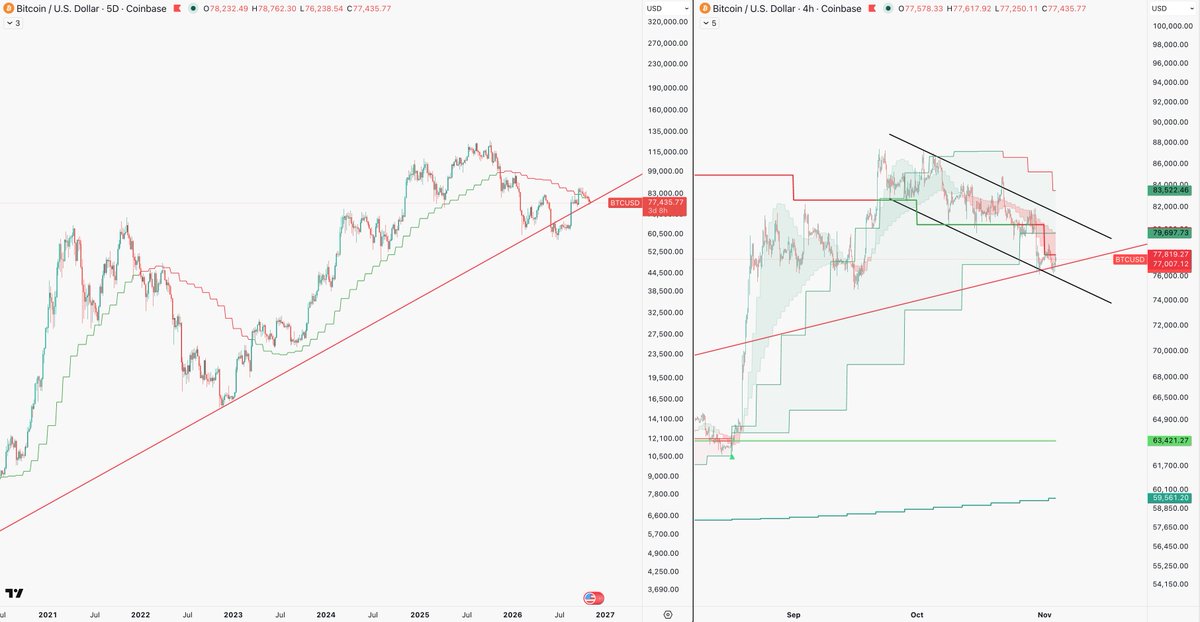
- Trading under the red cloud
- Under the macro bull/bear line
- Under the historical rising red trend line support
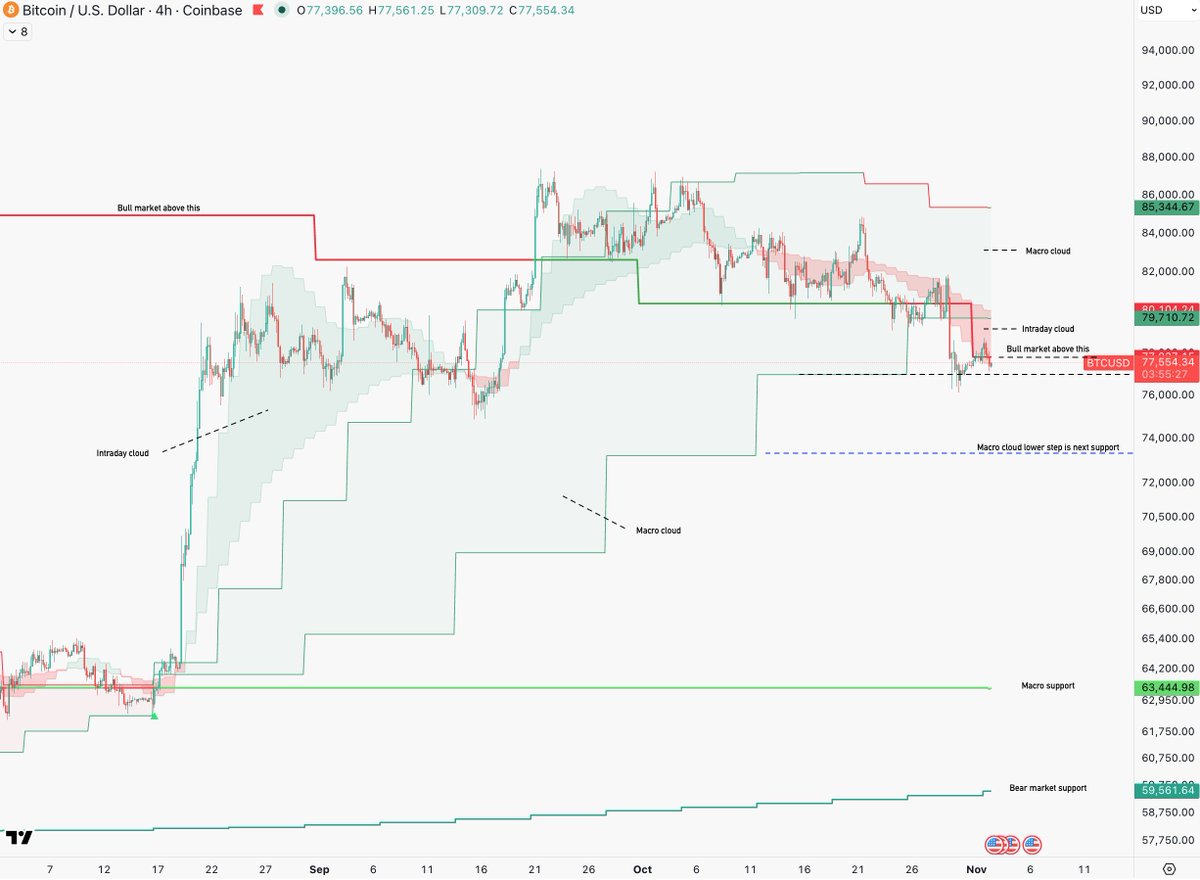
- Testing the rising slow macro steps as support:
- First support: 73.3k
- If that does not hold → next step at 68.9k
See prev post:
"Failing to regain the macro cloud, price can find support from the previous macro cloud lower step at ~73.3k"
The key 80.3k bull market threshold for Bitcoin (ticker $BTC) has now dropped to 77.8k as it continues to descend from 100k last December.
I’m watching the Macro cloud that turned green back in August and the Intraday cloud that flipped red on the 11th last month.
We want to see price reclaim the red intraday cloud as support and trade back above it while still sitting inside the macro cloud—a quick expansive move higher is usually confirmed once it clears and holds above the macro cloud, same as before.
Trading inside the cloud keeps this thing priced in and sideways, and critically right now we are under the macro cloud. Failing to regain the macro cloud, price can find support from the previous macro cloud lower step at ~73.3k
Price above the green macro cloud with the green intraday underneath is full bullish, under the red intraday is short-term bearish, and the main bias still comes from whether we’re above or below that 77.8k macro average.
I hope this makes sense, @grok expand/explain as needed. Concise, no spin.
@polarisbyte I would be biased bullish above that 77.6k level since it's a macro bull market/bear market marker with a lot of history. I'm not a flows trader, I'm more or a trend, swing trader.
OK, so the $BTC support at 75.5k broke down and is now being backtested, we want to see if the next 4h candle closes above this level or under it, key.
This level comes from the average buy price per bitcoin that $MSTR payed. But also, notice we remain under the 77.6k "bull market above here" level, under that bias remains bearish, above it bullish. Simple. Alos note it broke under its descending channel and is trying to regain it.
The macro cloud is close to flipping red, and the intraday cloud resisting price also at 75.5k. Key targets on price scale.
@polarisbyte Oh for sure, if they can't or wont' then it's not bullish. They have been defending ti since August, but if it breaks down then more confirmation of a bearish bias, to me that remain the case under 77.6k as I mention above.