AN OPEN LETTER TO TRADINGVIEW FROM AN ADMIRER
I’ve always been a big admirer of the team at @tradingview for what they’ve built and how they’ve transformed the charting experience for traders. I’ve also been quite vocal about the importance of investing in essential tools rather than hesitating over such costs.
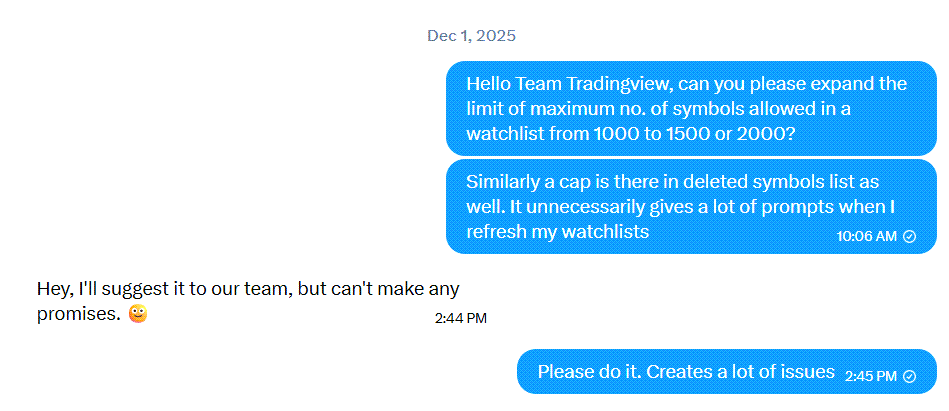
However, the recently introduced symbol limits per watchlist, even on paid plans, feel like a step backward. I understand the intent to increase ARPU and push upgrades, but reducing the Premium plan limit from 1000 to 500 symbols is quite restrictive, especially considering it’s already at the upper end of what retail traders in India can afford.
This change feels unjustified and, ideally, the earlier limits should be restored. If that’s not feasible, then at least increasing the caps would be a fair middle ground, bringing Premium back to 1000 symbols, and raising Essential and Plus tiers to 250 and 500 respectively.
Now, one might argue why anyone would need such a large number of symbols in a watchlist and how it actually helps.
What most traders, and even the team at TradingView, may not fully understand about India is the concept of circuit filters enforced by our regulators. This is quite unique to Indian markets. Since international platforms don’t provide a way to exclude stocks based on these filters directly in scanners, we are forced to first eliminate such stocks using local tools.
To avoid illiquid names, especially those stuck in 2% or 5% circuit filters, we have to create a refined “Total Universe” watchlist first. Only then can we effectively run scans on TradingView. If we skip this step and rely purely on inbuilt scanners, results often get cluttered with circuit-bound stocks, which are practically untradeable and hard to filter out afterward.
Currently, National Stock Exchange of India has around 2300 listed stocks. Even after filtering out illiquid names and those under strict circuit limits, we are still left with roughly 900 to 1100 stocks depending on market conditions. This already exceeds even the earlier limits. I had earlier requested increasing these limits, but the recent change has gone in the opposite direction, making it almost impractical to use TradingView’s watchlist-based scanning effectively in Indian markets.
I’ve used multiple platforms over the years, free and paid, desktop and web, and haven’t encountered such restrictive limitations elsewhere. This kind of constraint could actually give competing platforms an opportunity to challenge TradingView, at least in the Indian market.
On behalf of retail traders and the fintwit community, I would strongly request the TradingView team to restore the earlier limits. If changes are unavoidable, then at least consider increasing the limits as suggested earlier.
I’d also urge the fintwit community to support and amplify this, so the importance of this issue is clearly communicated.
How do I trade in bear markets when there are no viable setups?
This question comes from traders who've boxed themselves in. They're long-only, single-asset, single-timeframe VCP swing traders. But no business thrives on a product that works in brief windows and sleeps for months. Trading success in India demands either mastering multiple approaches or developing one adaptable core strategy. The Indian market isn't generous enough to let you waste those hard-earned pennies.
Markets don't flip between bull and bear like a light switch. These cycles flow gradually, usually lasting 3-8 quarters. Bull markets have downturns. Bear markets offer valuable opportunities.
This is backed by @swing_ka_sultan's market breadth sheet covering previous bear markets. The data reveals something interesting: even when markets stayed oversold for weeks or months with very few stocks above key moving averages, there were still windows offering high-probability trades. (Link: MBSheet)
Drawing from Dr. Van Tharp's insights, we can identify at least 6 basic market types:
Bull Normal: Upward trend with moderate volatility.
Bull Volatile: Upward trend with high volatility and momentum.
Bear Normal: Downward trend with moderate volatility.
Bear Volatile: Downward trend with high volatility and momentum.
Sideways Quiet: No clear trend with low volatility.
Sideways Volatile: No clear trend with high volatility
For a long-only momentum trader, the only truly dead market is a volatile bear market. Stocks plummet with strong downward momentum and bounce rarely. During these times, preserving capital is the wisest choice. But even then, a thoughtful trader knows that conscious inaction is still a form of action.
In all other market conditions, the paradox isn't about when to trade, but how to trade differently. Adjust your risk or modify your execution style.
First-Order Opportunities:
Episodic Pivots and EP pullbacks: Fundamental catalysts showing resilience regardless of market conditions
High Relative Strength stocks: Those rare stocks that have withstood the market decline and landed on everyone's watchlist
Shorts: More than half of the Small and Mid-cap universe is in Stage 4 or late Stage 3 decline.
Parabolic Longs: Oversold stocks that have fallen sharply and are primed for a temporary bounce
IPO's: Fresh narratives unburdened by market history
Second-Order Adaptations:
Timeframe Arbitrage: What's invisible daily becomes visible in intraday timeframes - 5/15/60 min
Position Sizing: The art of staying small but staying present
Execution adaptations: Anticipate limited follow-through, buy at tight entries, and sell quickly for small gains.
P.S. You can read more about the adaptations here - Adaptations 1 (https://t.co/9HT067wZlG) , Adaptations 2 (https://t.co/9HT067wZlG)
Remember: Trade the markets you are in, not the markets you wish you were in.