$BTC MVRV Z-Score
No way $60k was the Bear Market bottom. MVRV hasn’t even dipped into the green bottoming zone yet!
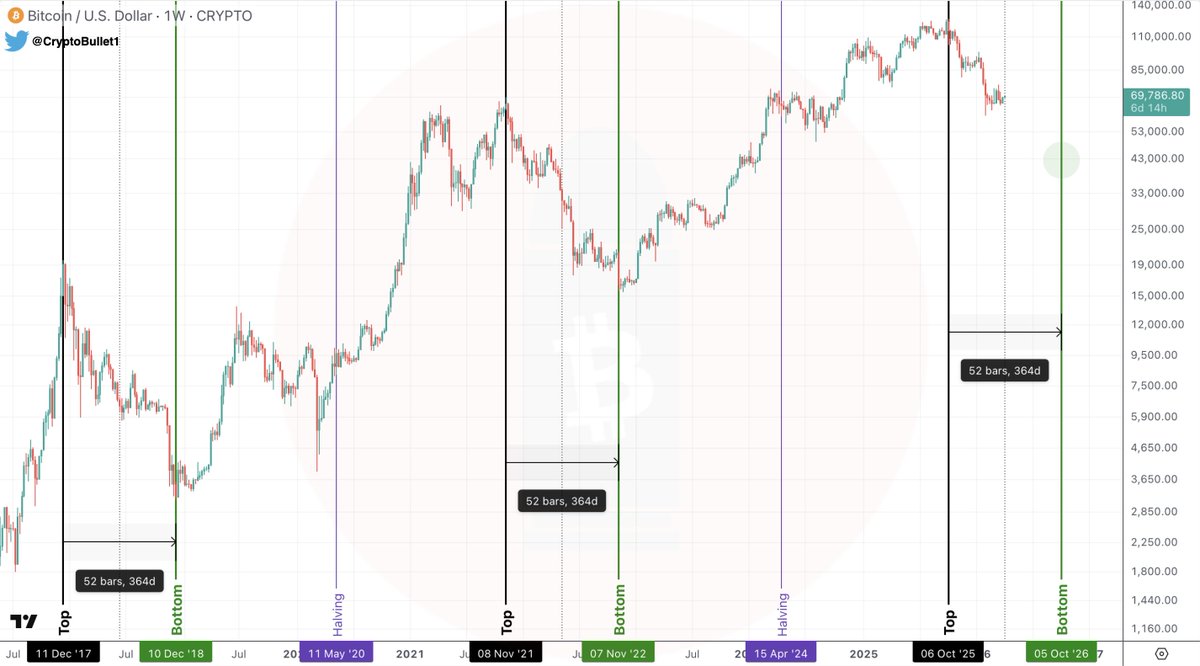
And in terms of timing, we still have 6 months of bear market left.
📉 Another major drop is inevitable, whether you like it or not
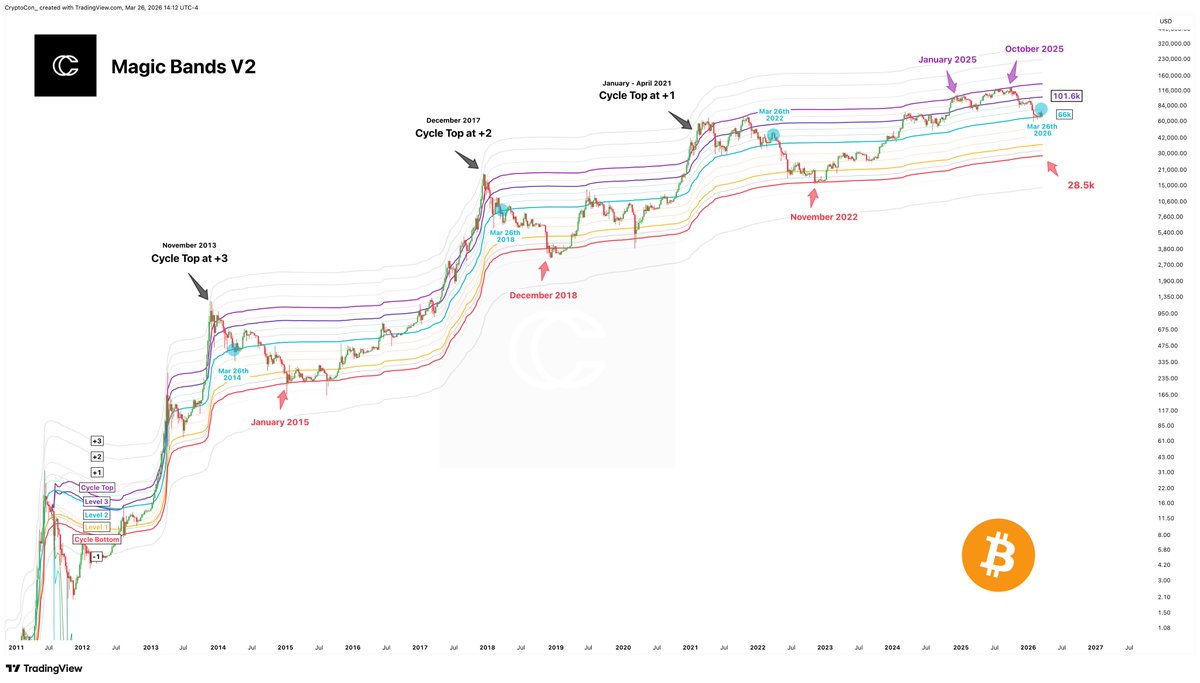
March 26th of the bear market is looking more or less like any other bear market March 26th, hanging out around Level 2 of the Magic Bands V2.
The cycle bottom band is at 28.5k and has been precisely retested in each cycle.
However... It's good practice with indicators or models with an "always" performance to allow something different to happen. Maybe that's a bottom at yellow level 1 (37k), or potentially higher/lower than that.
Data metrics first, then important price levels.
Anyway... the Magic Bands bear market performance so far is practically the same.
Again we find that this March in the bear market is really no different than any other.
Short-term MVRV makes a bearish retest in January/February, followed by a brief bounce and high in March.
There are typically two more bearish retests to follow before confirming the cycle bottom.
SOPR profit is low, but not cycle bottom low.
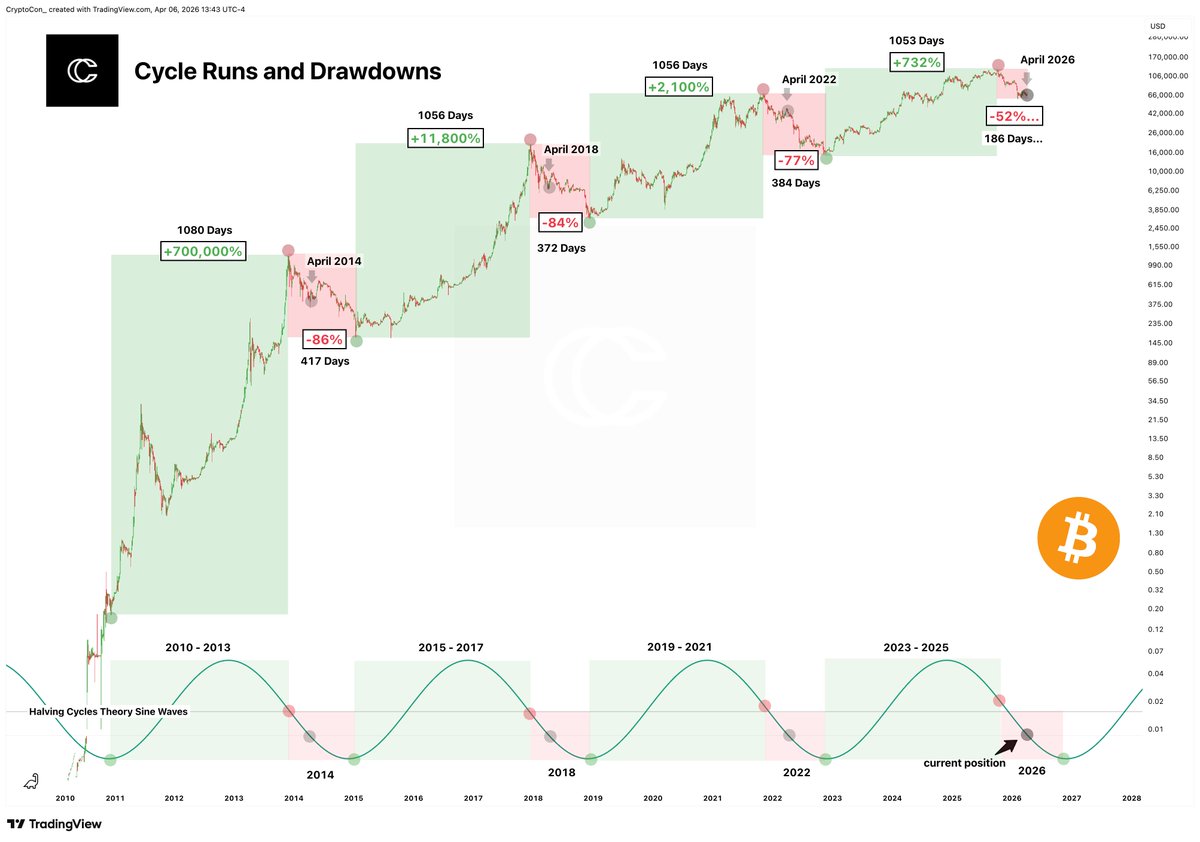
The metric continues its journey to high loss territory, set to take place later this year according to the Halving Cycles Theory.
Current bear market stats:
Highest drawdown: 52%
Length of correction: 186 days
Average bear market stats:
Highest drawdown: 82%
Length of correction: 391 Days
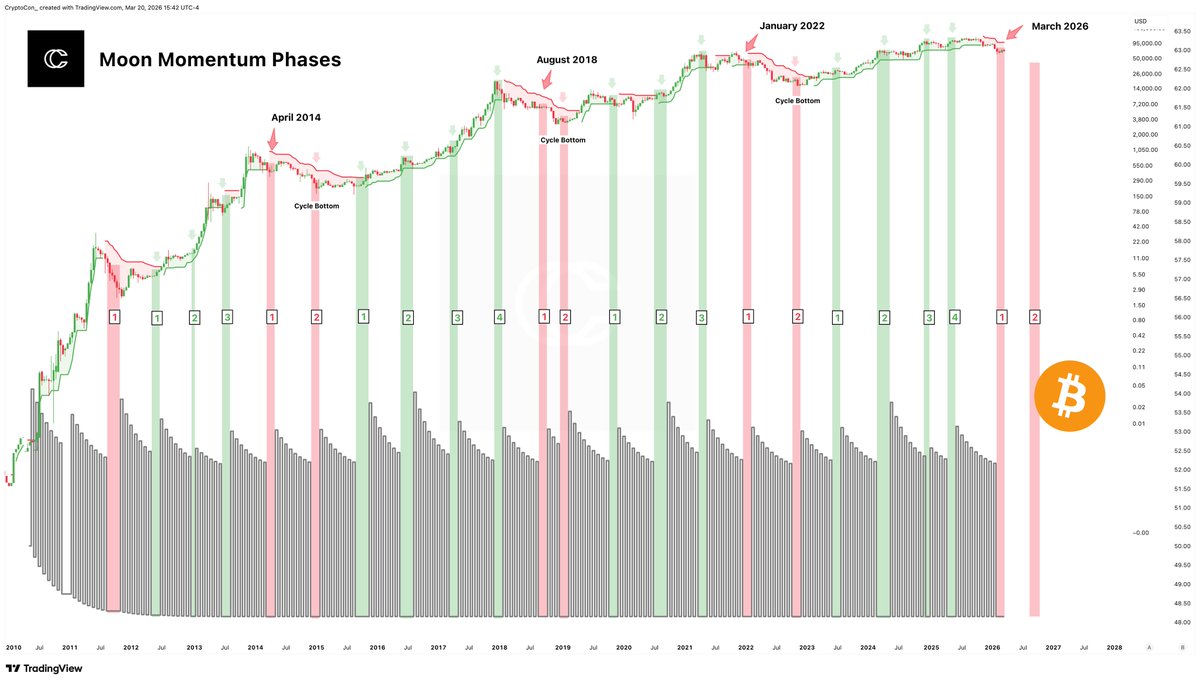
The absolute most consistent thing about Bitcoin has been the Halving Cycle, almost as consistent as the people who say it's going to change/break at every high and low.
Returns have diminished each cycle; it is also assumed that drawdowns will diminish each cycle too, but I don't think that's the case.
I see plenty of takes on X claiming that the cycle bottom is in here, again defying the cycle and calling for a low 25% less than the chushiest bear market in half the time.
Like last cycle, I firmly believe you will start to see a lot of "firsts" or "Bitcoin has never done this before! It's over!" Like breaking below the 200 Week MA, or going below previous ATHs in 2022.
Different, but not different.
Interestingly, at the same relative RMC RSI in each cycle, Bitcoin was 1 month out from reaching cycle bottom prices or retesting the RMC Moving Average.
42.5k in a month? Maybe.
Would that be the cycle bottom? Also maybe, in the same way that June 2022 was the cycle bottom but retested the moving average again in November 2022 at lower prices (16.5k).
Using Realized Market Cap, I've created the simple bands, different from the Magic Bands, which use Volume and are more specific.
It's nice to have easy, effective price models, which this does well. A cycle bottom band, a top band, and a midline.
Price just broke below the mid-line, which is standard for halfway through the bear market. That's a common theme of current data.
The cycle bottom band is usually visited twice, and it's currently at 42k. A plausible cycle bottom price.
Metrics like this almost make it look too easy; it's the narratives (super cycle and super doom) that keep it running.
In the bear market zone of the monthly stochastic RSI, right on time.
According to the typical time frame once it's entered, the bear market will last until November of this year, which lines up with the Halving Cycles Theory.
The big thought now is "This all seems too easy, surely something has to be different!".
And it will be, but the differences are typically subtle. the Bitcoin cycle has always found its way to stay on track.
$60k was NOT the bear market bottom for $BTC, don’t fool yourself.
1. There're still about 6-7 months left in this bear market
2. We haven’t tested the Realised price (we always go below it)
3. We’re $24k above the CVDD price
4. We haven’t even touched the 200-Week MA yet!
So what the fuck are those ‘60k was the bottom’ believers talking about??
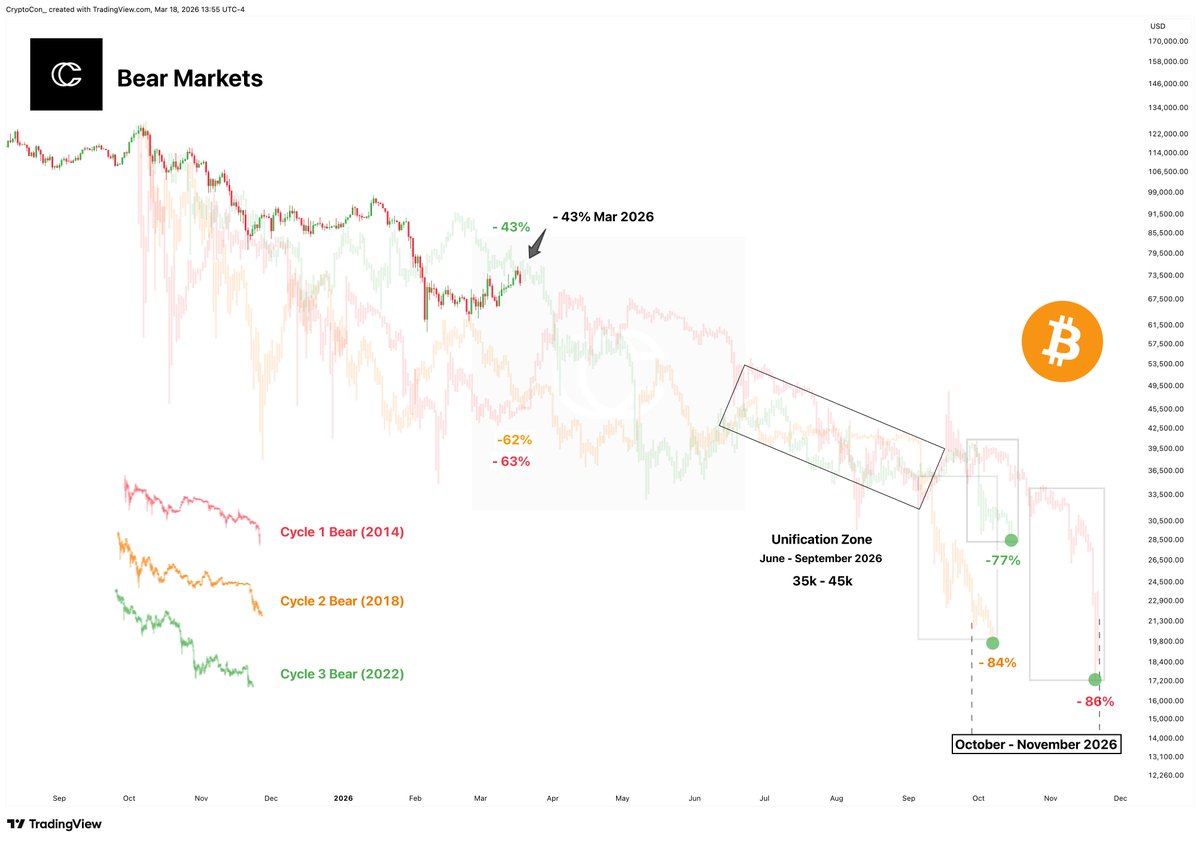
The current Bitcoin bear market now lines up with last cycle's (2022) after a brief period of worse performance.
According to other cycles, the most likely next step is a decline to 45k and eventually 35k, where drawdowns unify from June to September.
That's not unlikely given the room most indicators have to go before bottoming out, and bottom support metrics which line up in that zone (35k - 45k).
It's the last drop that does most of the damage, which has been the part that decreases every cycle. It will be interesting to see what happens then! (October - November of this year)
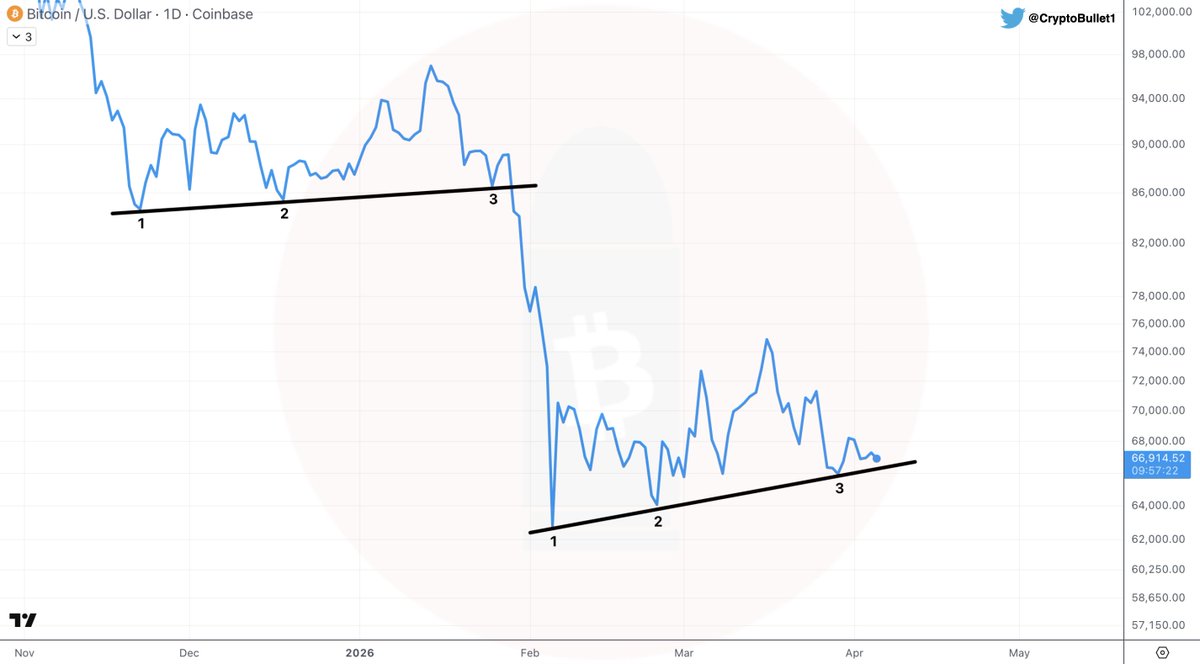
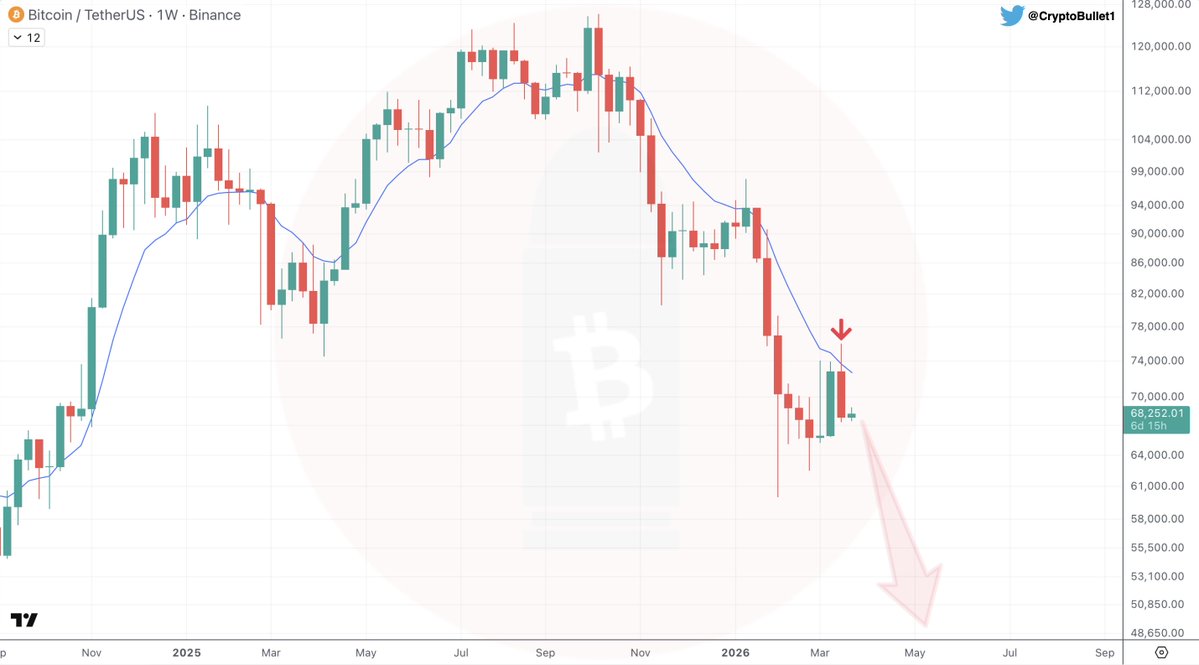
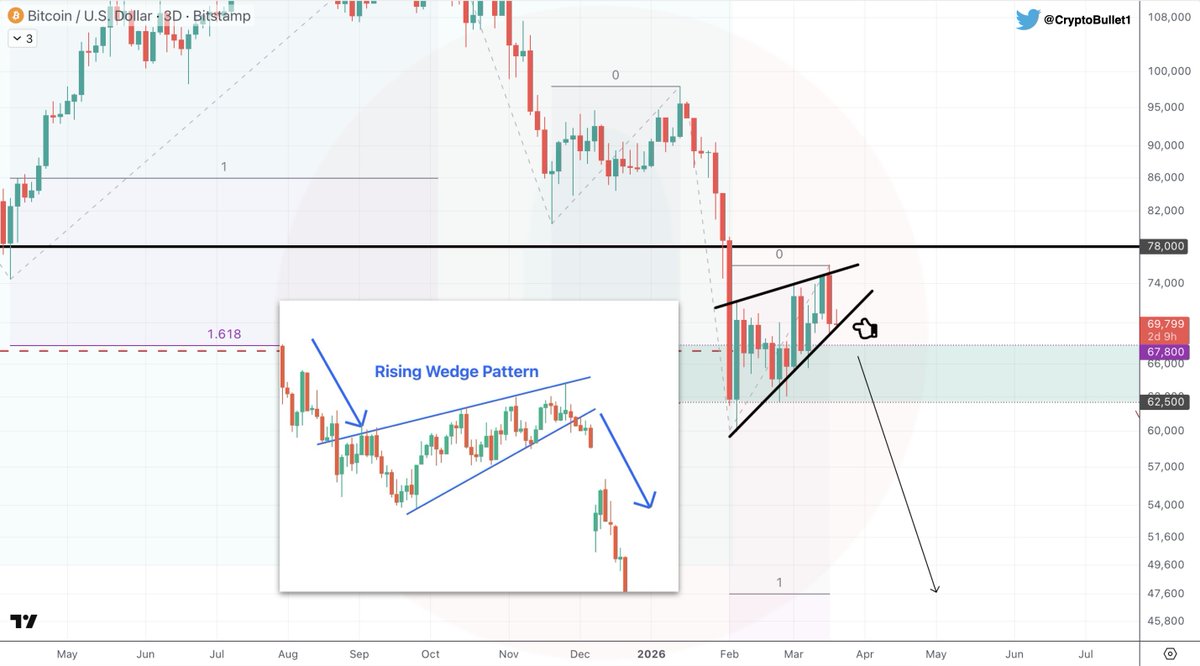
Still short, nothing’s changed.
But I don’t think they’ll close this monthly candle red.
So, we could see 11 straight days of $BTC holding above 66K before the next monthly candle opens.
We’ve had 5 red monthly candles so far, the most on record is 6.
Target sub-60K remains the same however, we likely have some more hunts before that occurs.
ETA: 1-3 months. Enjoy the Chop.