This afternoon's session at @Assoc_MPOs focused on the data provided through the Census Transportation Planning Product (CTPP) and how it can be used to inform transport projects throughout the country
At the second session at @Assoc_MPOs today we brainstormed some ideas to improve Nicholasville Road in Lexington
From BRT, changing land uses and prioritisation at signals, it was great to hear all the different ideas, and make use of some Lego!
On the final day of @Assoc_MPOs we started the day learning about the data available through the Bureau of Transportation Statistics
It was great to see the data they have compiled and are making accessible to MPOs
The final session of Day 2 at @Assoc_MPOs highlighted the importance of school safety. Using the example of an elementary school we came up with ideas on how to improve safety and reduce conflict between cars, buses and pedestrians
The Prairieville interactive network design game at @Assoc_MPOs gave us a fun chance to create a new bus network for the fictional area of Prairieville, complete with coloured string and sticky notes! It was great to experience balancing different priorities and see alternatives
The latest session at @Assoc_MPOs focused on making use of traffic count data to help identify poor data and trends over time
We also looked at a proposed high speed rail line in Texas and how data was used to highlight it's benefits
Session one of today gave us a great chance to see how Oregon Metro have used crash data to build new tools in their goal to reach zero fatal road injuries
Some great discussions highlighting the variation in data availability and how it is being used in different areas
We're back at @Assoc_MPOs Planning Tools and Training Symposium for day 2! Come round and say hi and learn more about how our tools can help you get the accessibility data you need
At the second session at @Assoc_MPOs gave us a chance to test out an active travel corridor prioritization tool. It was great to see how data can be compiled to rank corridors and understand how data from our tools could be used as inputs
It was great to join in with the Designing Better Maps and Geospatial Apps session at @Assoc_MPOs where we aimed to solve the problem of data silos within development planning processes with the creation of a new web app
We're on site in Lexington, Kentucky for the @Assoc_MPOs Planning Tools and Training Symposium and excited to be a part of it!
If you're here too, come and say hello and chat to us!
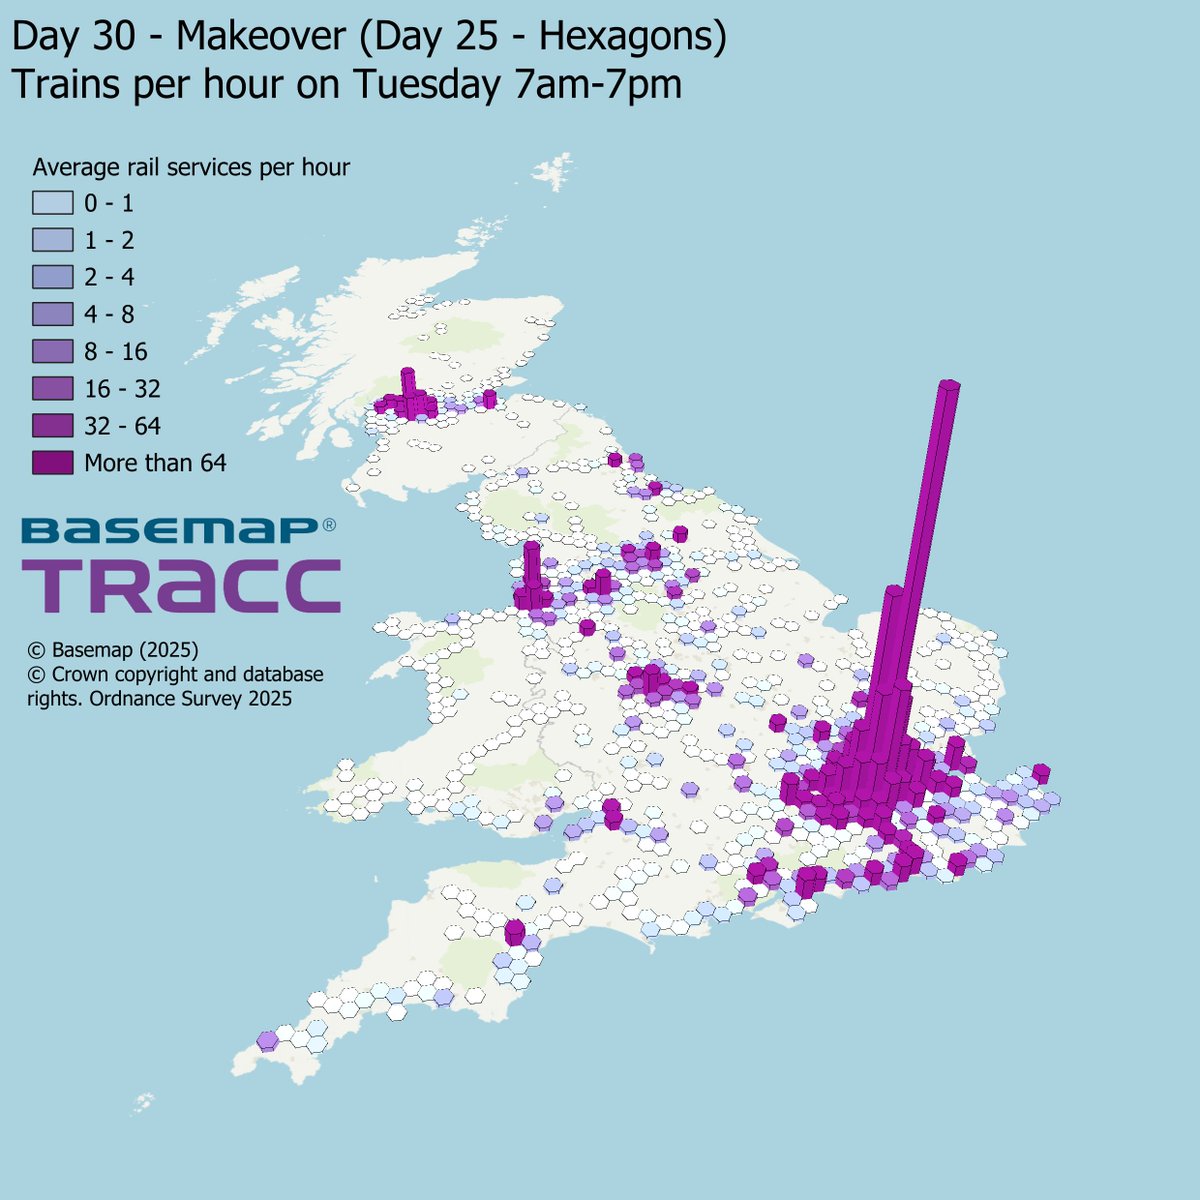
Day 30 of the #30DayMapChallenge – Makeover
We turned our trains-per-hour hex map into 3D, London & the South East towering above the rest.
And that’s all 30 maps! A fun challenge, lots of data, lots of tools thanks for following!
#DataViz#Rail#Hexagons#GIS#Mapping
Day 29 of the #30DayMapChallenge – Raster
We used OS Zoomstack to find lakes (>0.5 km²) in Cumbria, calculated cycle times to their centroids with TRACC, then styled the output as a raster with hillshading giving it an elevation-map feel.
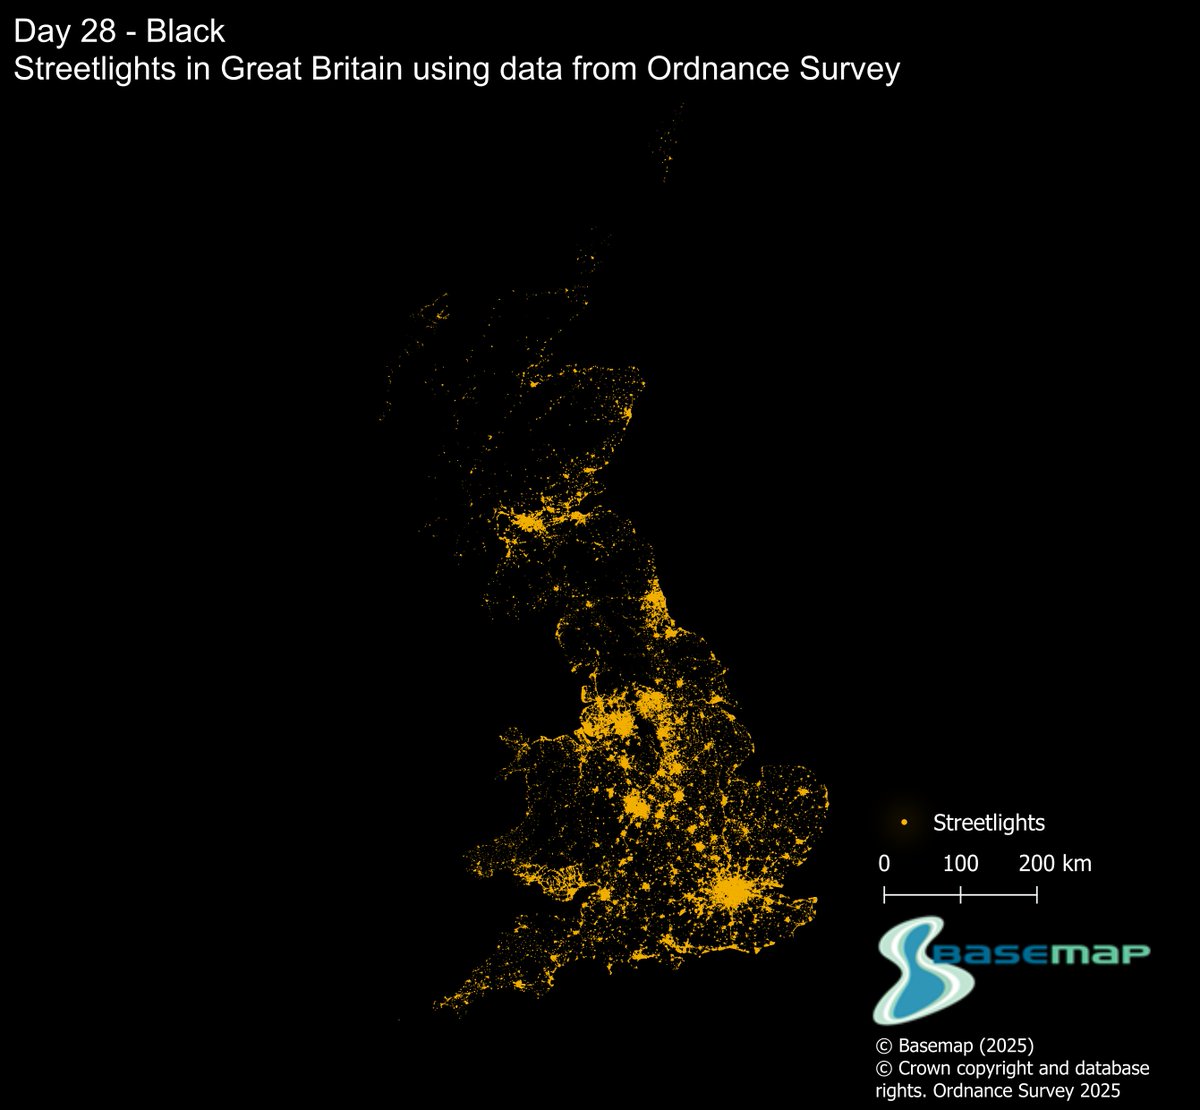
Day 28 of the #30DayMapChallenge Black, using new @OrdnanceSurvey streetlight dataset, we mapped streetlights of GB on a black background.
Even with land visible, streetlights outline the country perfectly and we use it in TRACC to spot unlit roads and plan safer walking routes.
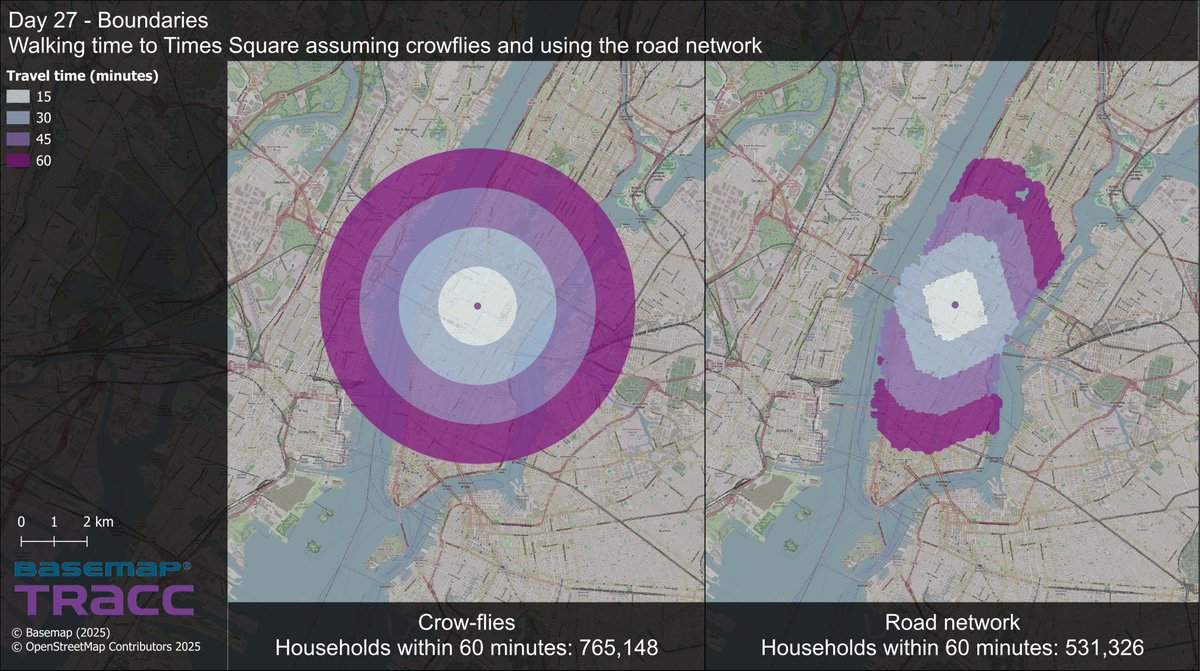
Day 27 of the #30DayMapChallenge Boundaries, we mapped 60-min walking access to Times Square using crow-flies vs the real road network.
• Crow-flies: 765,148 people
• Real network (Hudson/East River as barriers) 531,326
Boundaries matter
#DataViz#Accessibility#NYC#Mapping
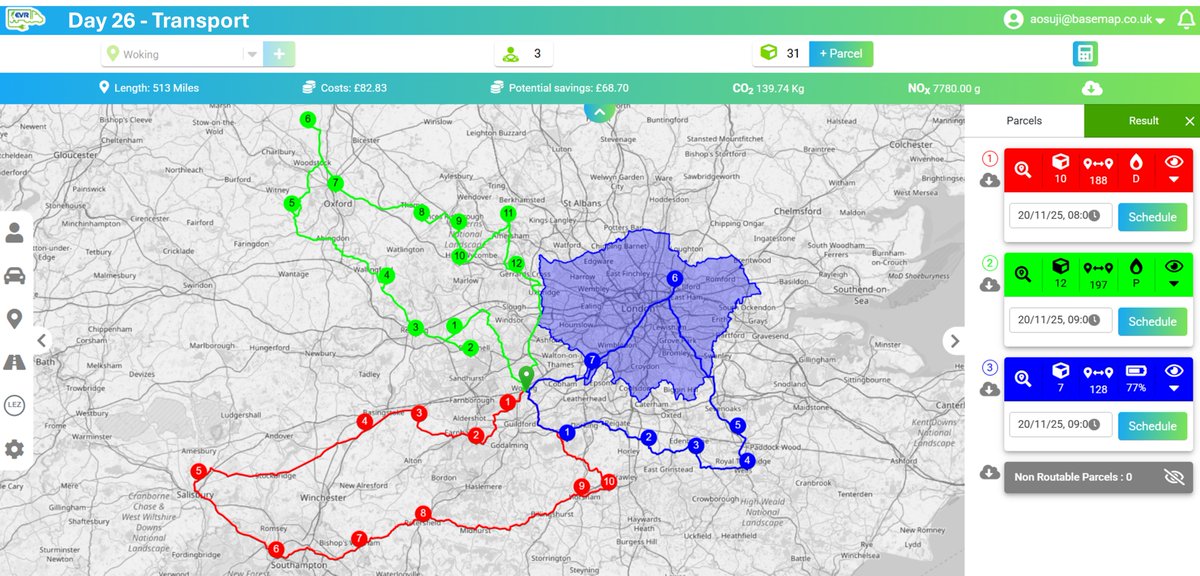
Day 26 of the #30DayMapChallenge Transport
Using EVR, we planned 3 routes from Woking to deliver 31 parcels — including how ULEZ affects petrol/diesel vehicles.
The EV could complete all routes, saving ~£70, 140 kg CO₂, and 7.8 g NOx.
#DataViz#Transport#Routing#EVs#EVR
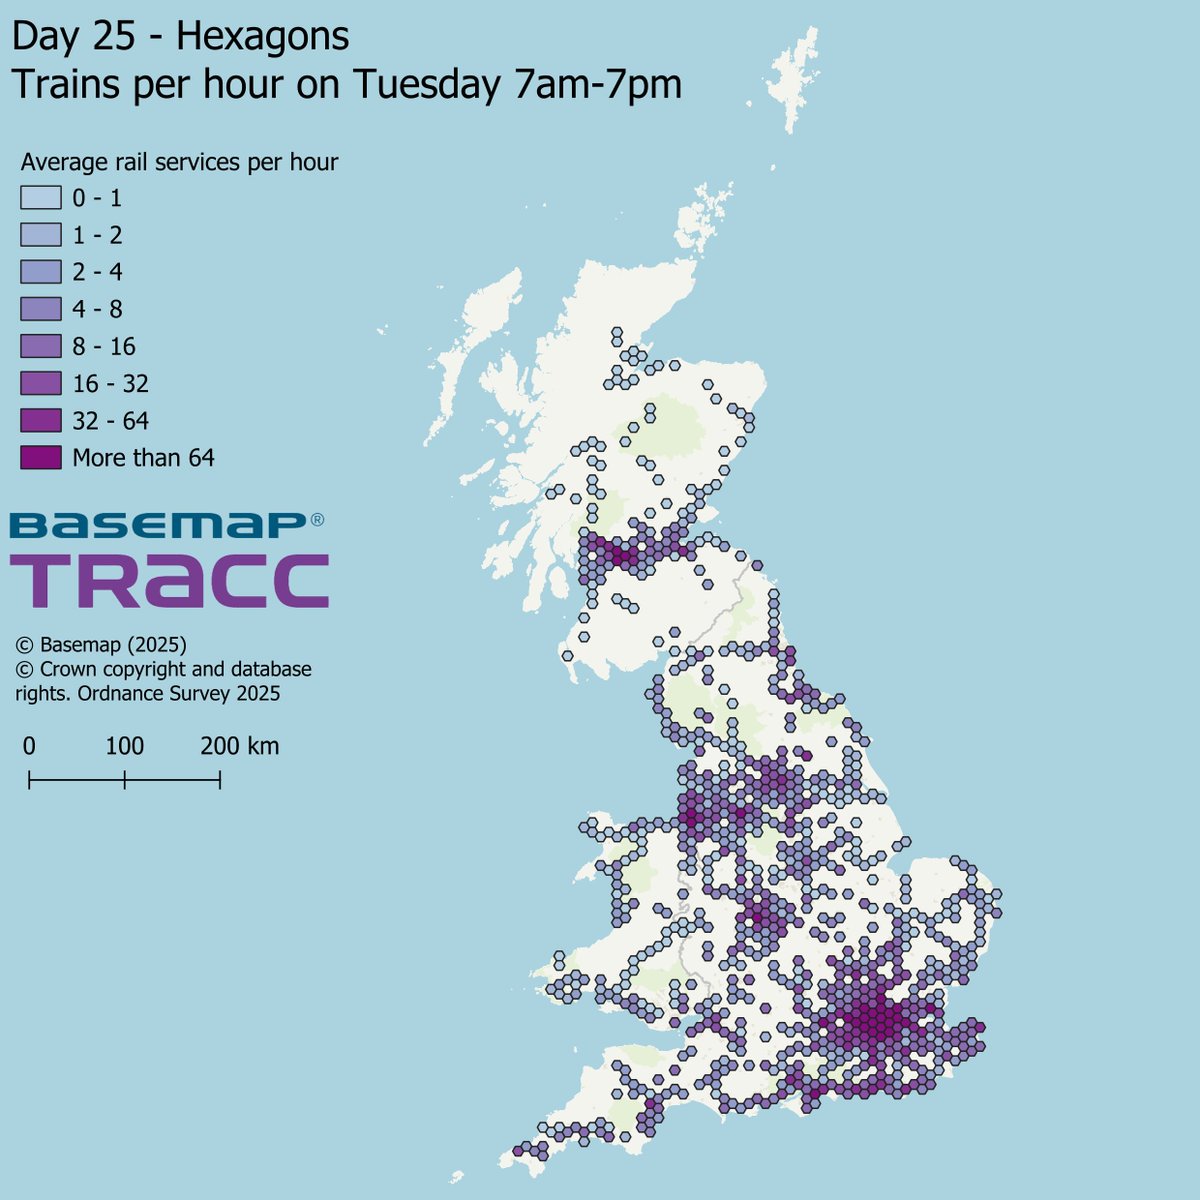
Day 25 of the #30DayMapChallenge Hexagons
We split Great Britain into hexagons and used TRACC to calculate the hourly average number of trains (Tue, 7am–7pm).
Clear hotspots: the South East, Manchester–Liverpool–Leeds, and the Glasgow–Edinburgh corridor.
#DataViz#Rail
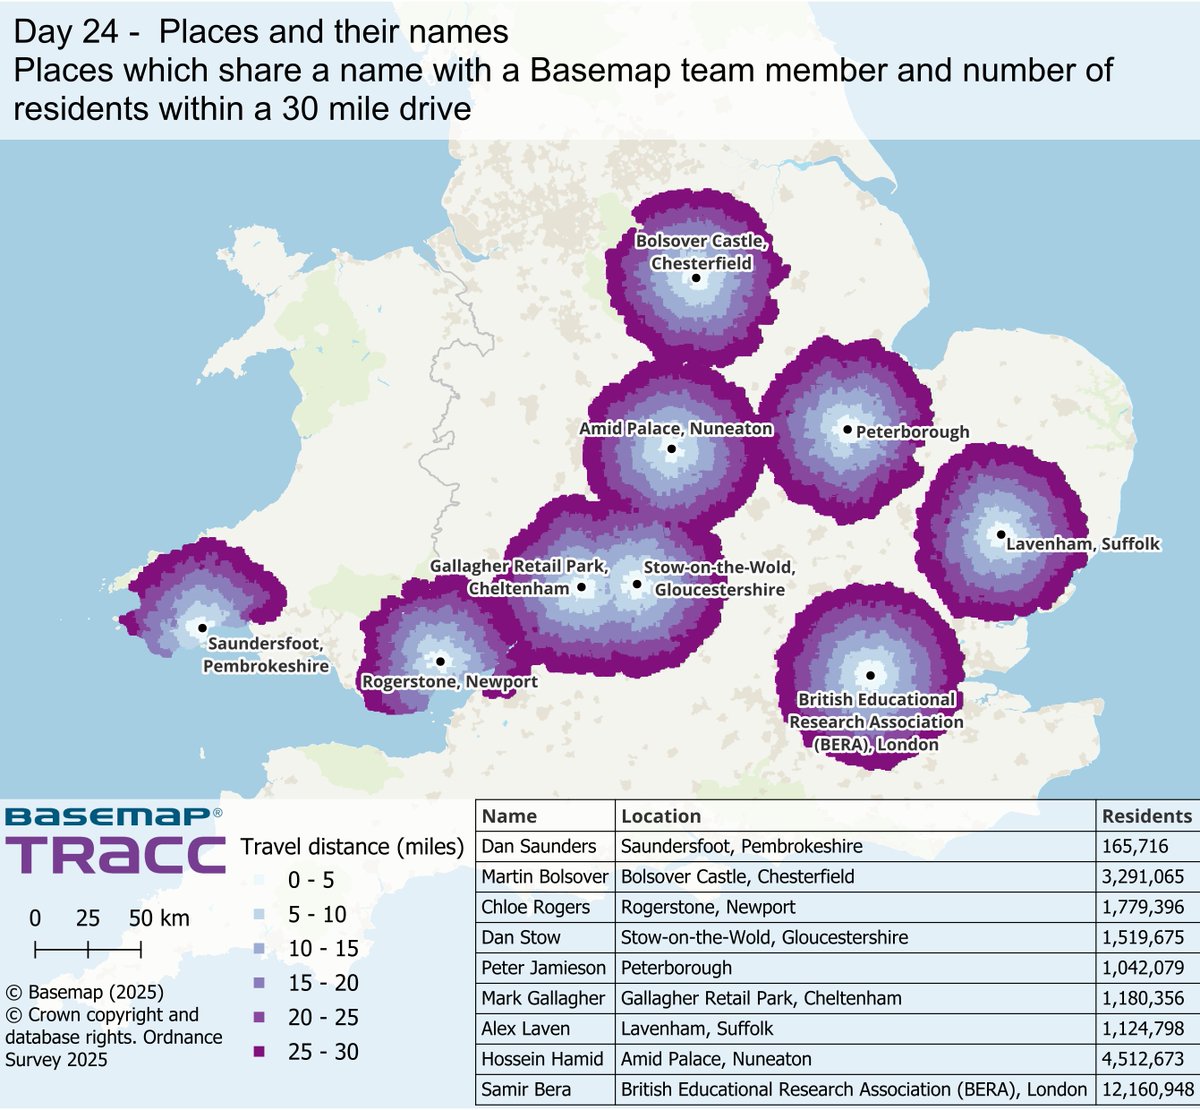
Day 24 of the #30DayMapChallenge – Places and Their Names
We mapped 9 places that share names with staff from Stow-on-the-Wold to Lavenham and calculated how many people live within 30 miles of each.
Winner? Samir Bera over 12 million near “BERA”!