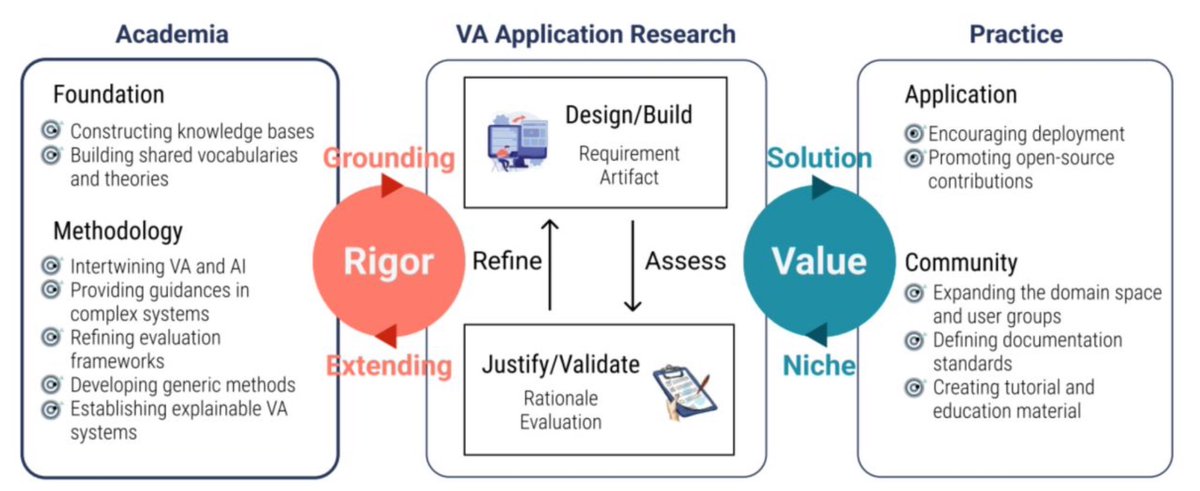
What are some of the grand challenges in visual analytics applications? Recent @ieeecga article outlines a research and development agenda for making Visual Analytics application research more rigorous and impactful. #VIS#AI#ML https://t.co/yCEm5NBj95
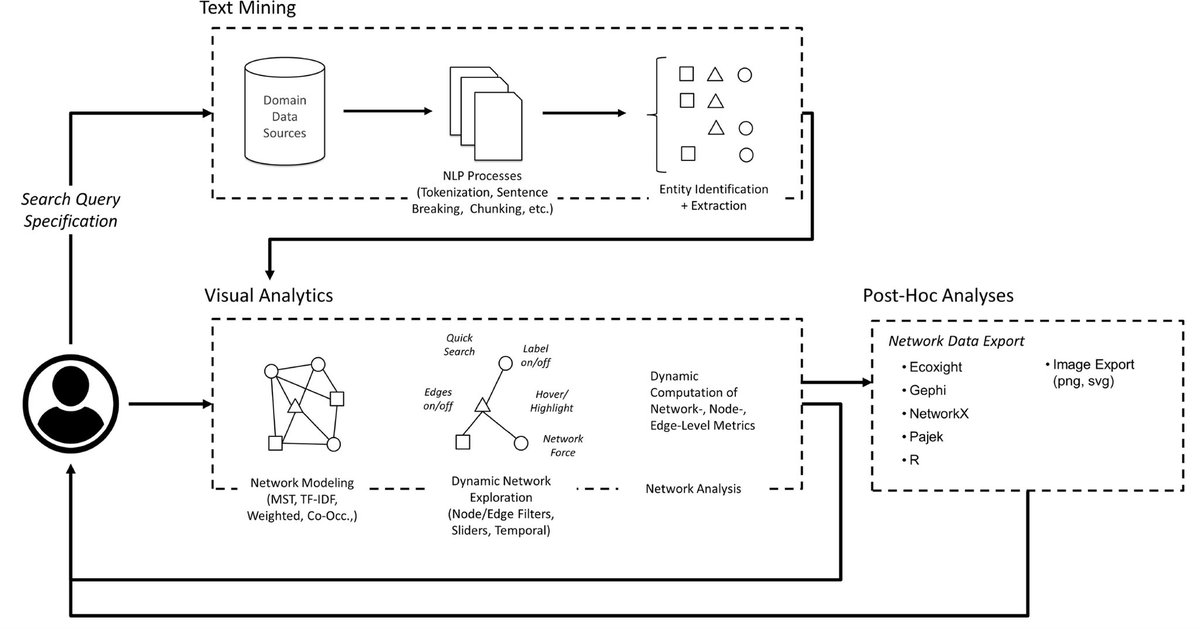
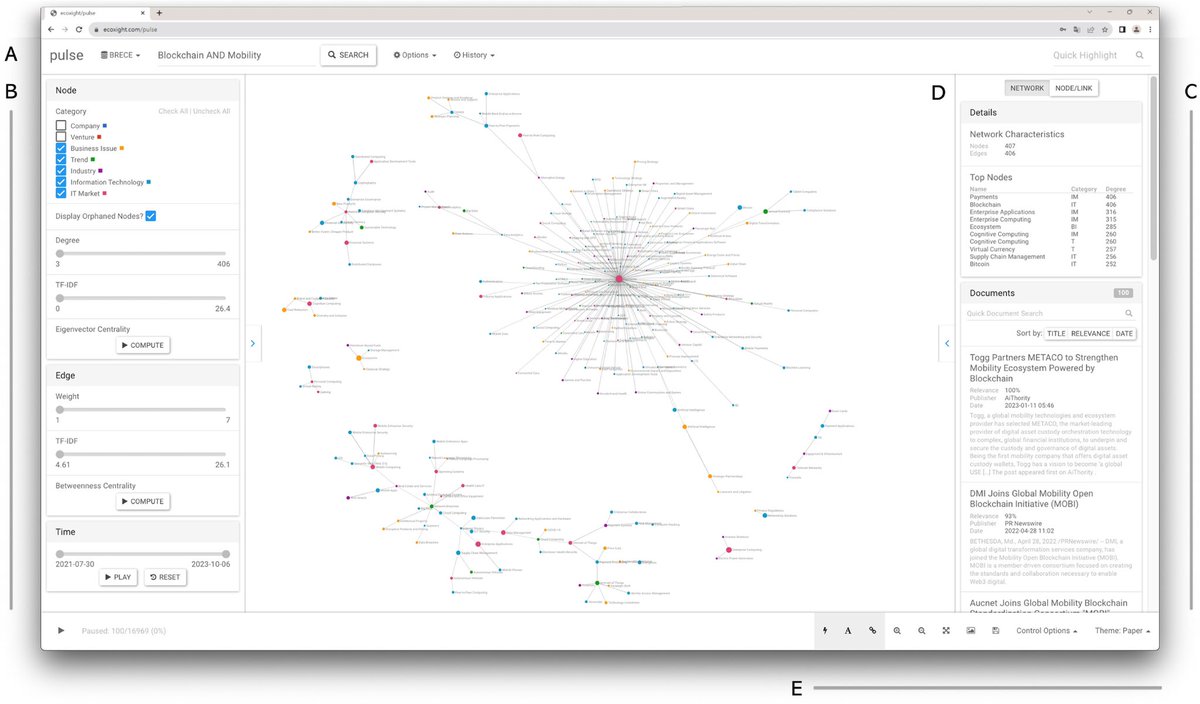
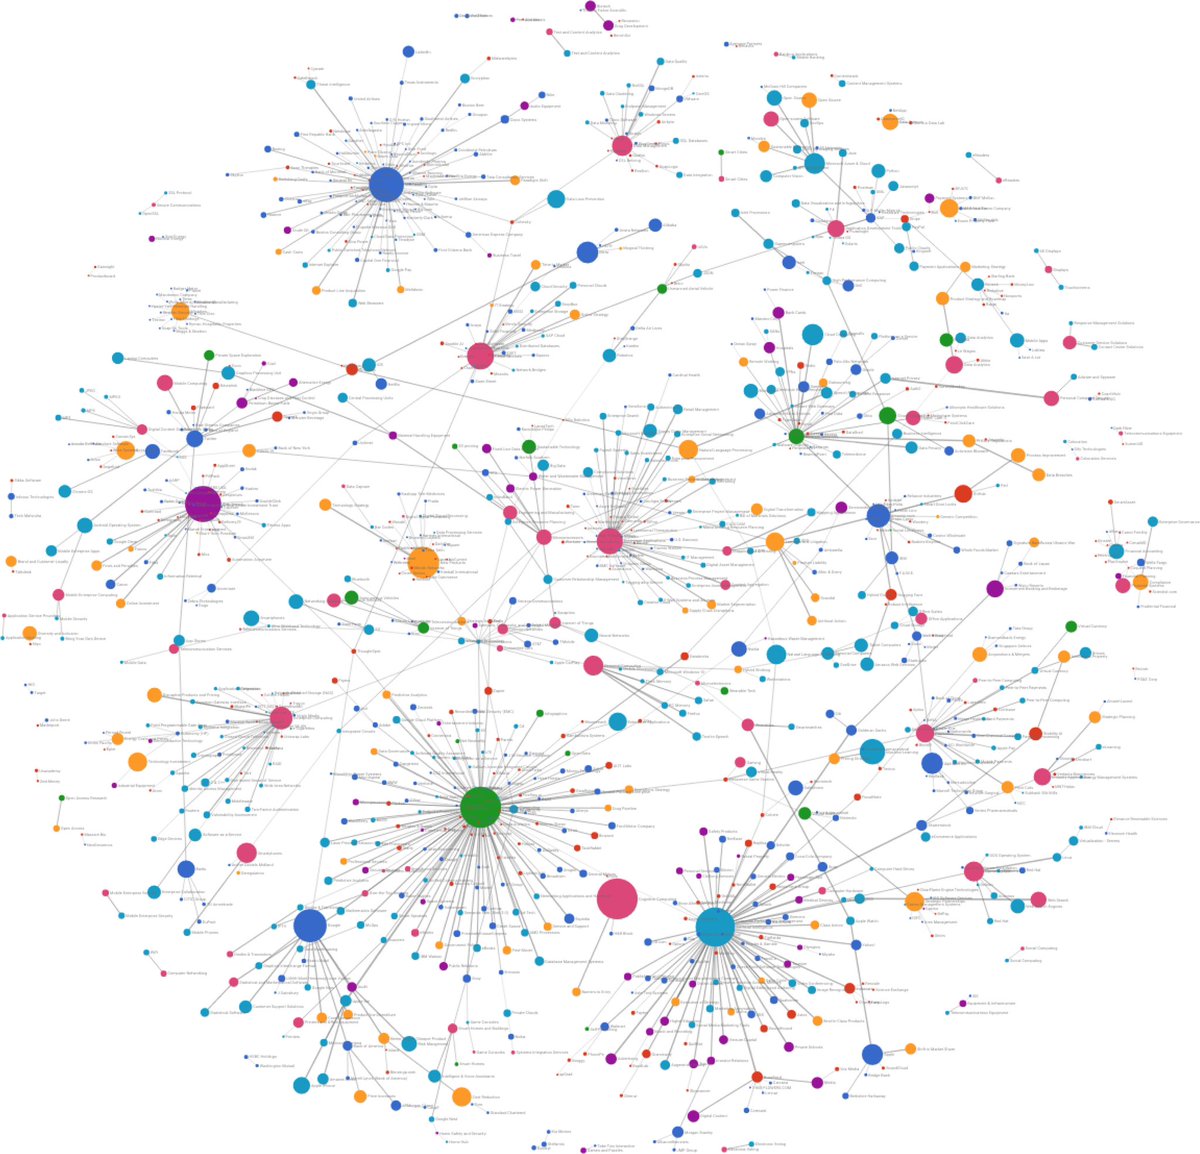
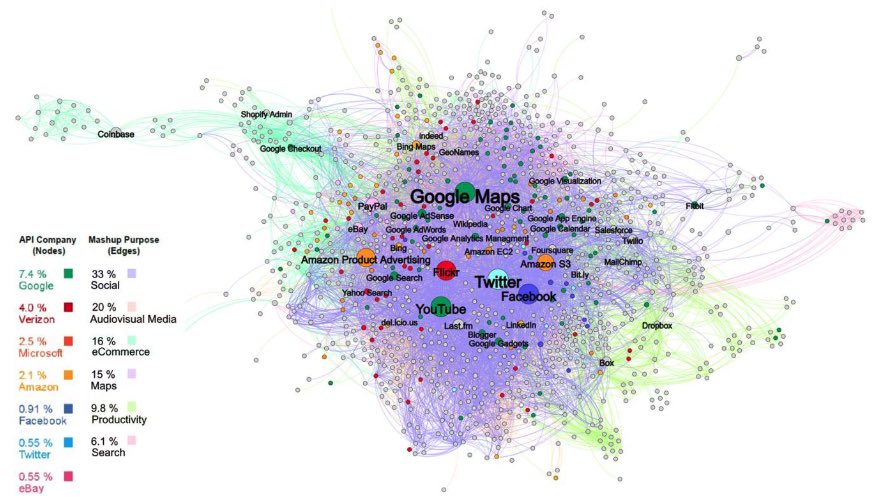
What insights can you gain from unstructured business ecosystems data? New research presents an interactive #AI-powered visualization approach to augment decision makers’ understanding of complex business ecosystems. #VIS@hwpark@dseuss@northernlight https://t.co/bxCi0KeSaG
Honored to have our work on the intellectual structure of low-code development research nominated for best paper in the software technology track at #HICSS57. Congrats to my co-authors Ali Asad Syed Naqvi, Markus Zimmer, @kristinalemmer, @drews_paul. https://t.co/QPjW9gZ5F1
HICSS, one of the longest-standing scientific conferences in information systems, technology management, and system sciences, kicks off this week. Check out the program here: https://t.co/Qn7z4W50yl #HICSS57#AI#ML#VIS@HICSSnews@INFORMS@IEEEorg
This is truly exciting. @Accenture is launching a network of #GenAI Studios to help enterprises accelerate use of data and AI technologies across industries and functions. #VIS#Data#AI https://t.co/f2osZarOac
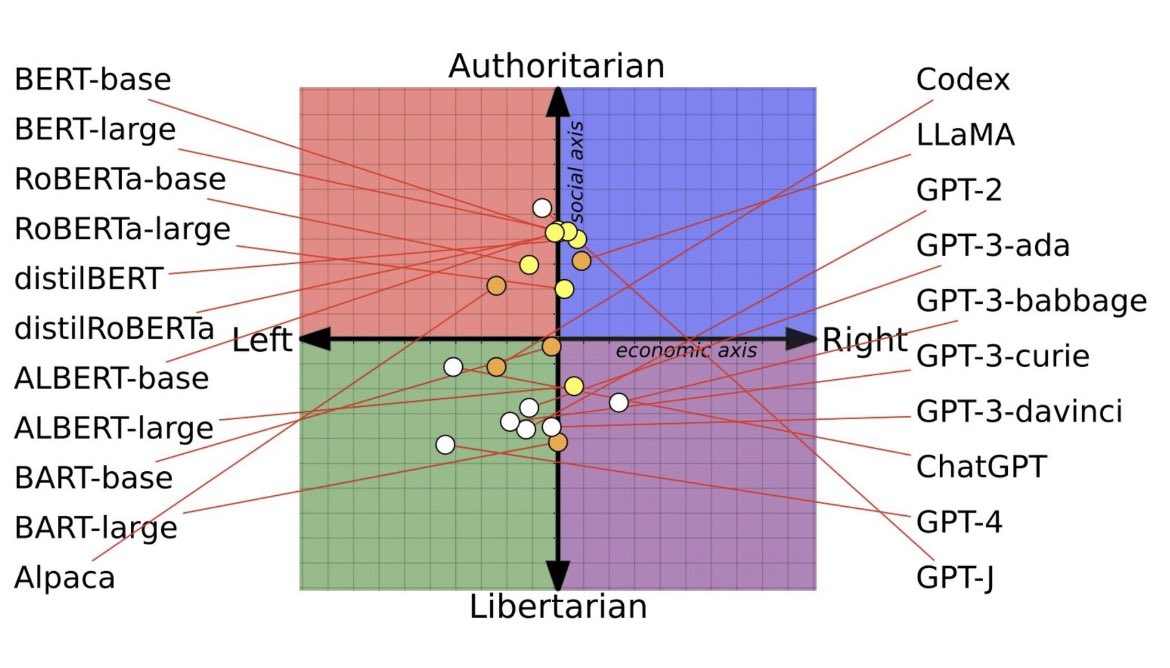
Visualizing political biases in language models (LMs). Research shows that LMs, pretrained on diverse data sources, can have political leanings that reinforce the polarization present in pretraining corpora. Need for end-to-end transparency. https://t.co/ZqqZuPtuFR #AI#ML#VIS
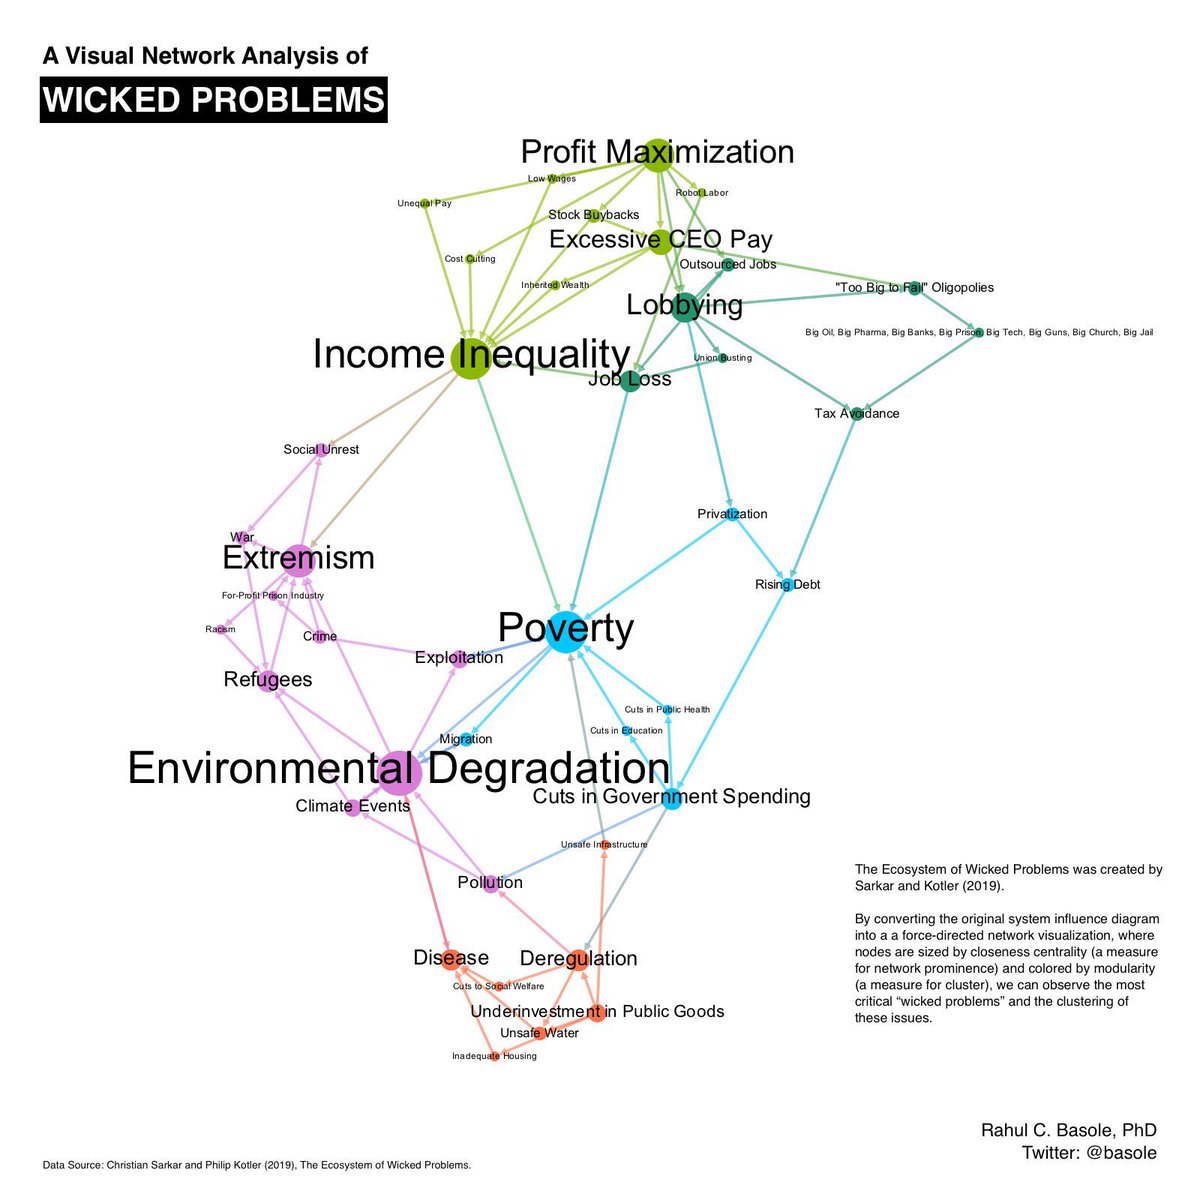
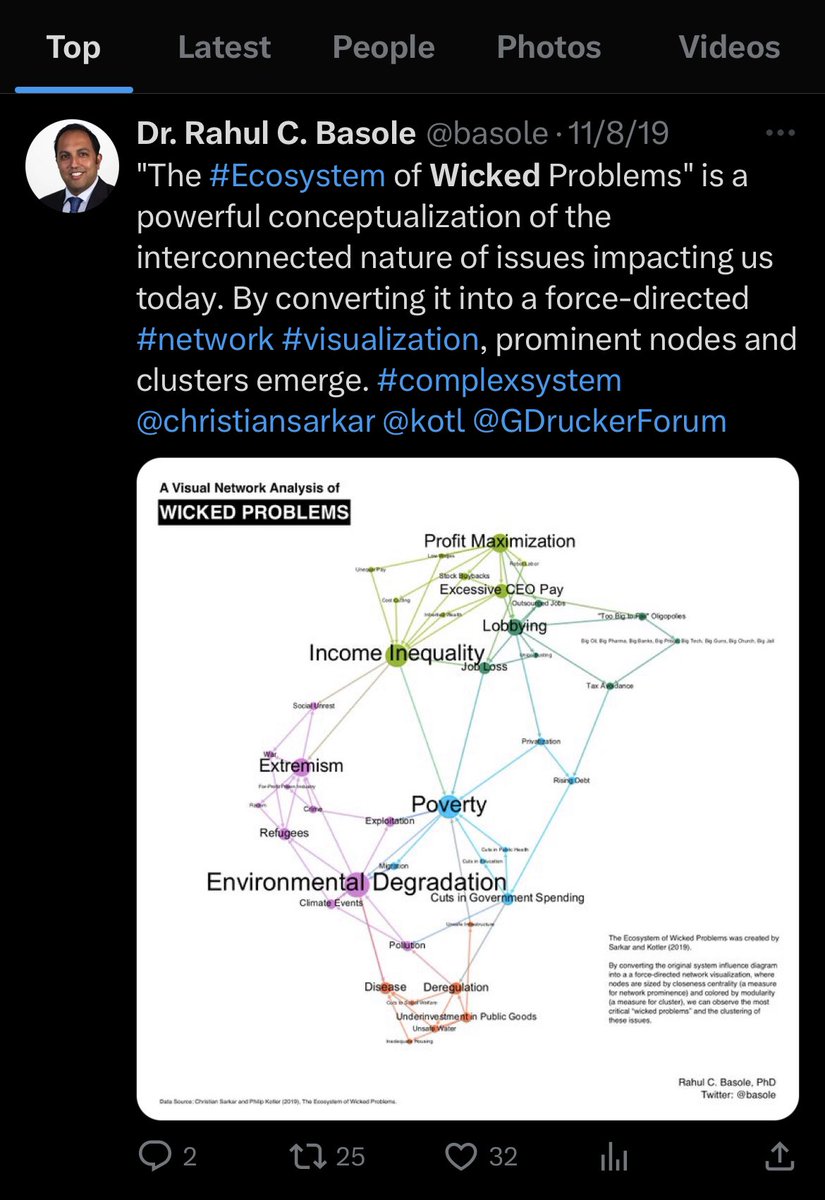
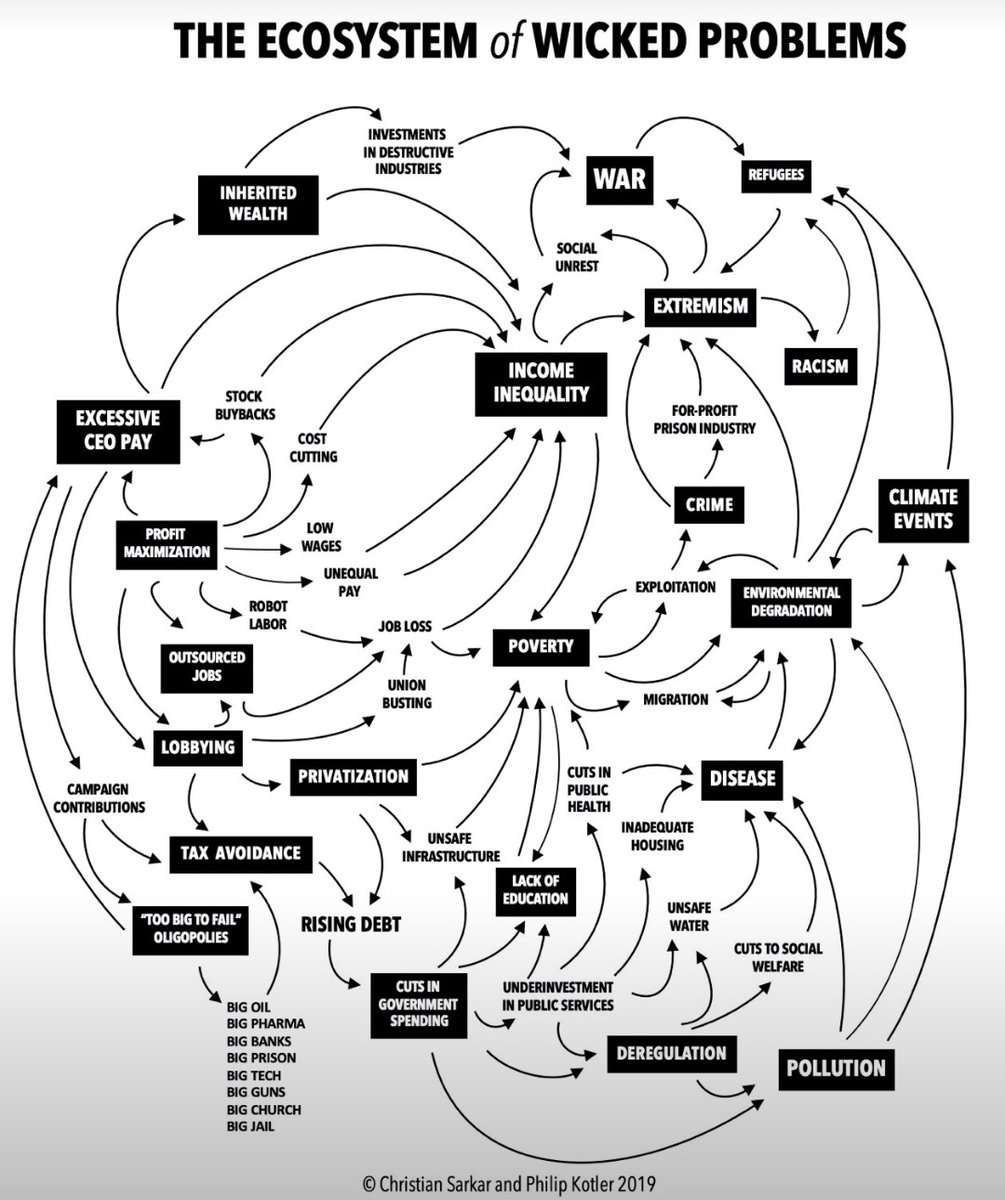
By definition, the root cause of a directed graph is the node that has no parent node. Based on a visual network analysis of these wicked problems, the evidence points to “Profit Maximization”. @Toffeemen68 @christiansarkar @kotl
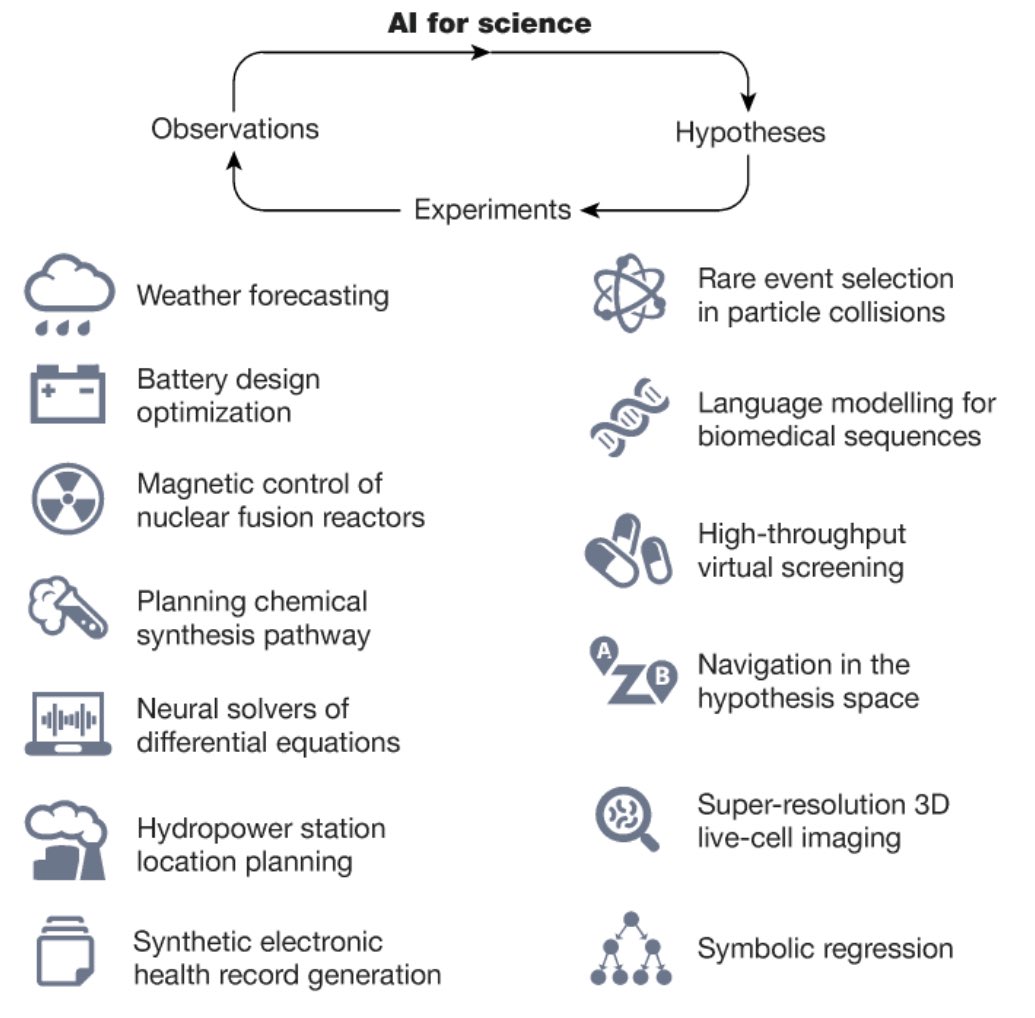
How will #AI transform science? In a recent @nature paper researchers from 38 institutions highlight that AI is poised to reshape scientific discovery by augmenting and accelerating each stage of the process, but grand challenges remain. https://t.co/luN8uXt9EK #AI#ML#data#vis
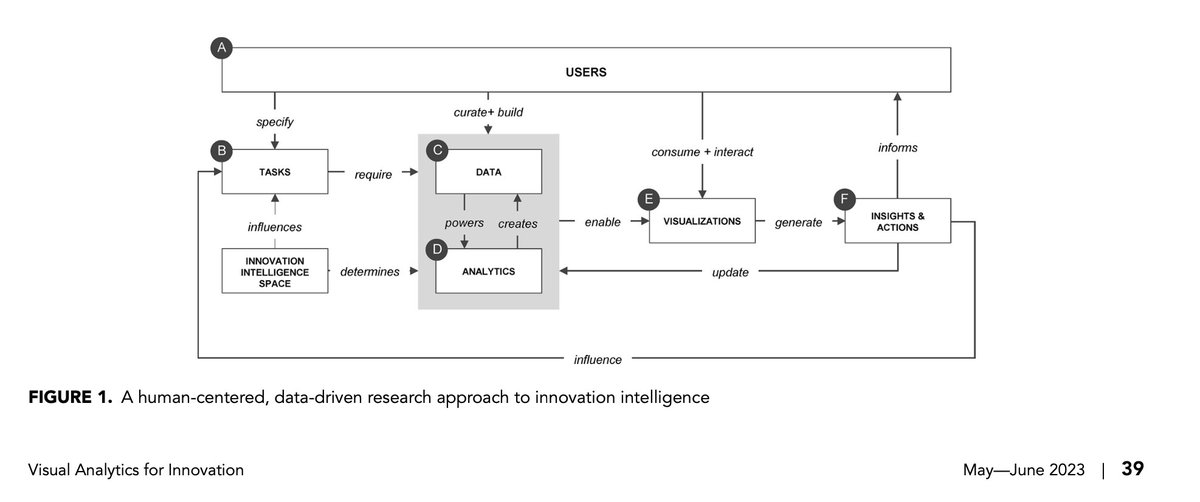
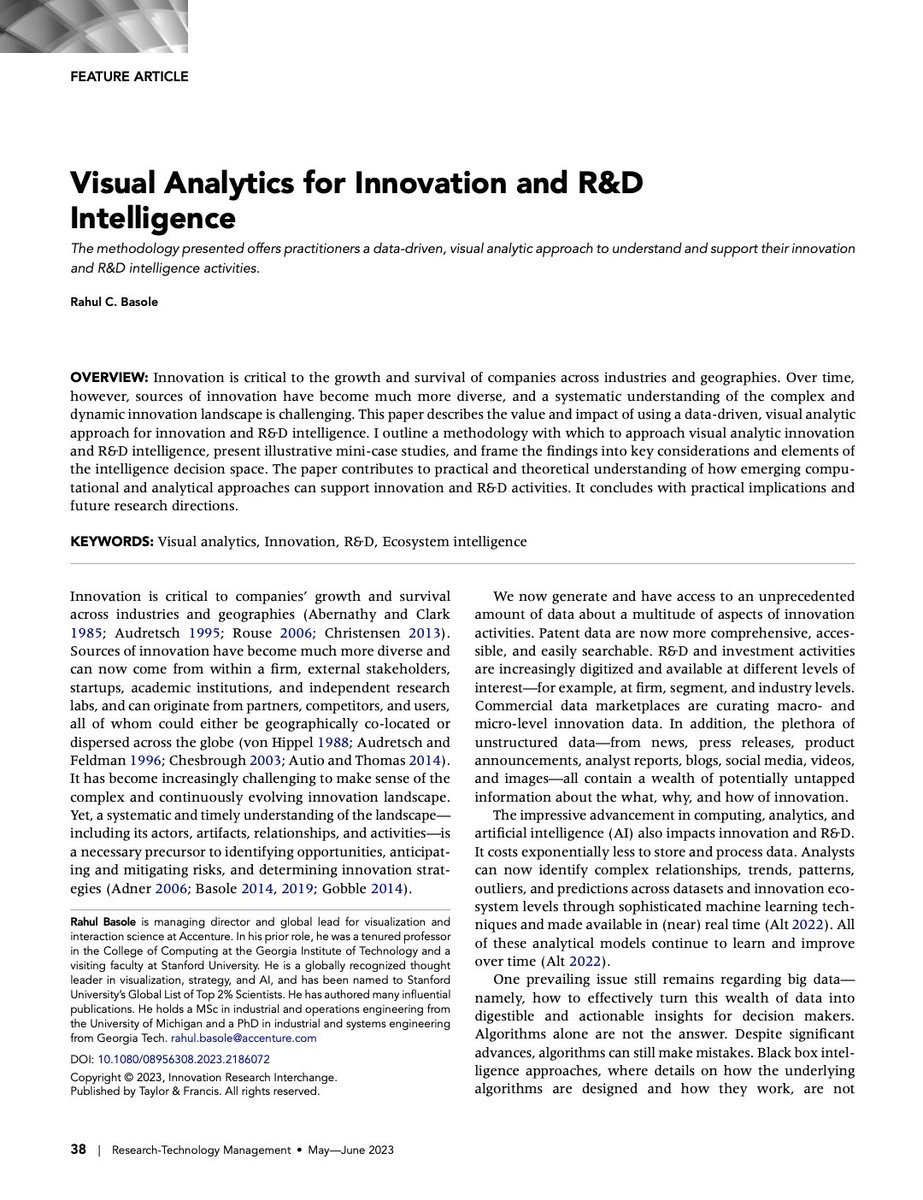
If you happen to be interested in all three topics, you may want to check out a recent @RTMJournal paper that describes a framework for and experiences with developing visual analytic systems for innovation and R&D intelligence. https://t.co/99NnzomBPR @AOMConnect#AOM2023
The 2023 #AOM conference is kicking off with some interesting sessions today, ranging from using #visualizations for strategy work and researching #openinnovation to exploring what's next week for #ecosystem research. Program: https://t.co/R4rEtZ1i61 @AOMConnect
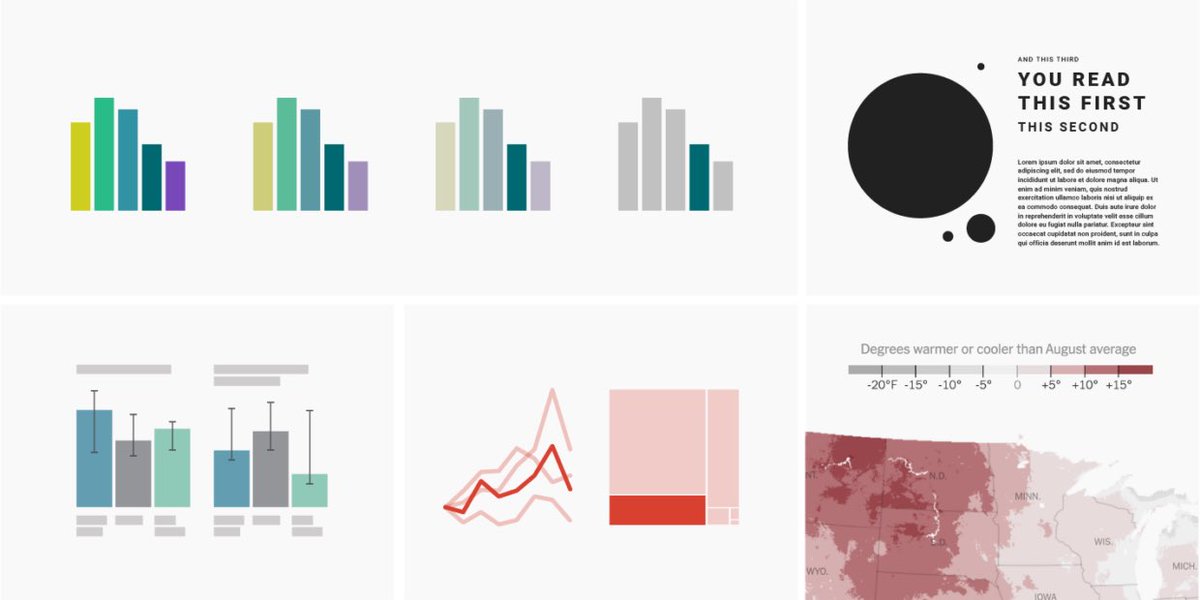
Excellent blog post by @lisacmuth from @Datawrapper on the use of color to emphasize what you want readers to see first, second, third, or last in your data visualizations. https://t.co/r5uxVs56rl #VIS#AI
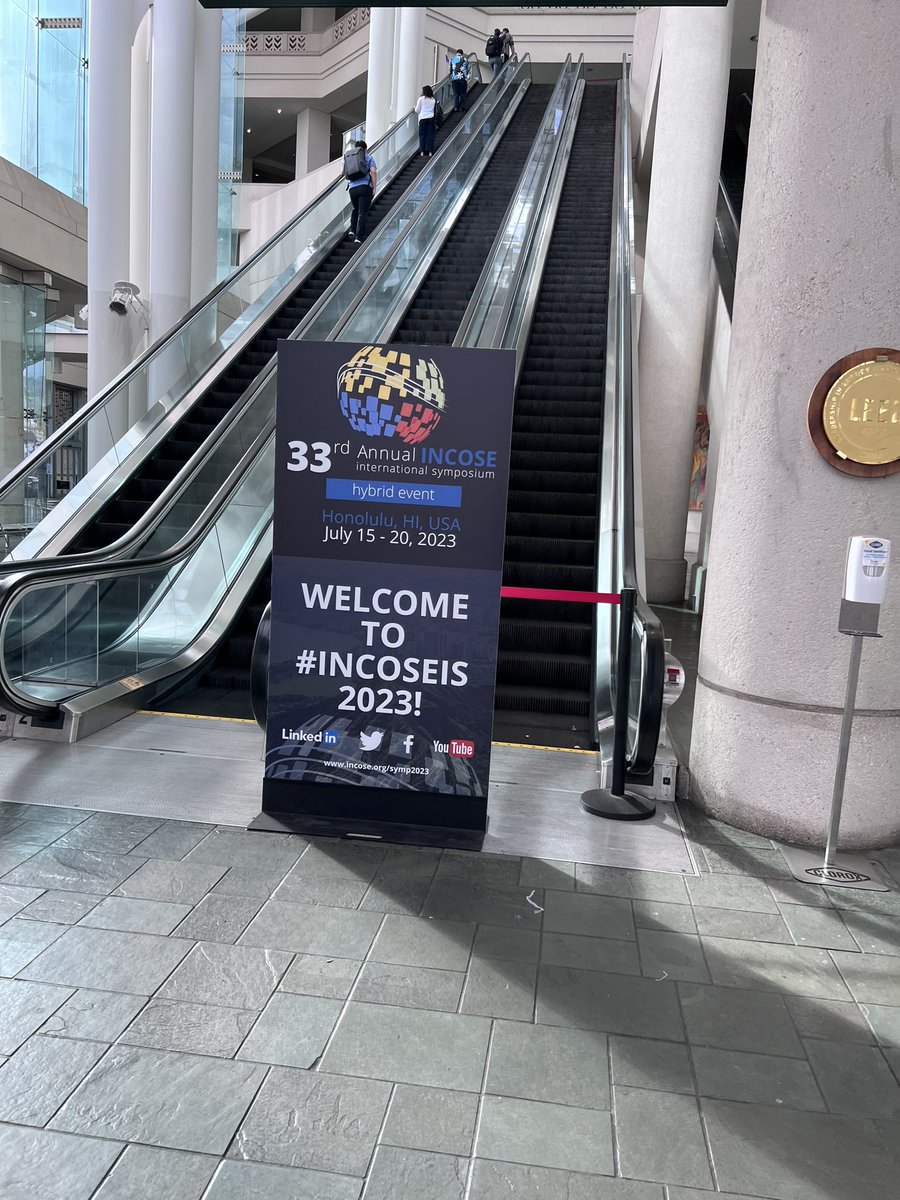
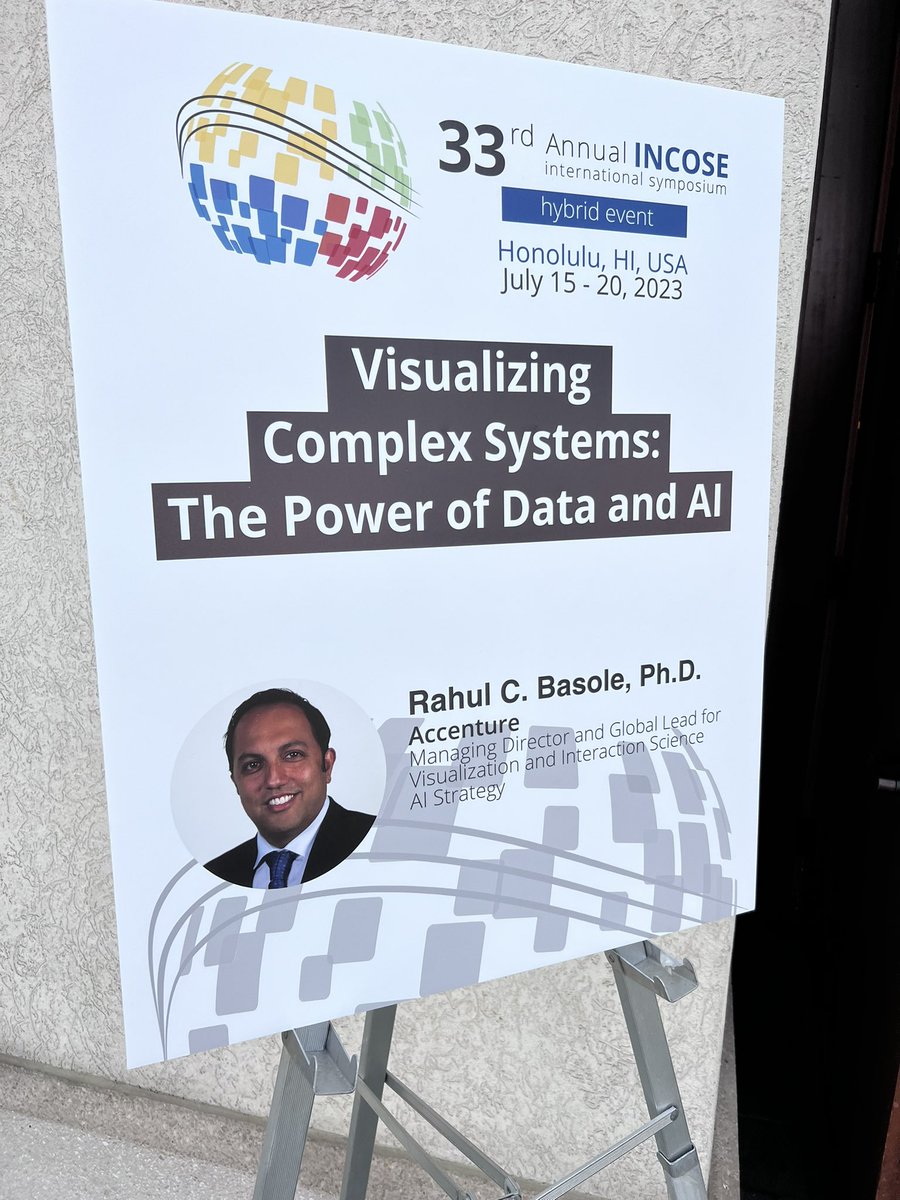
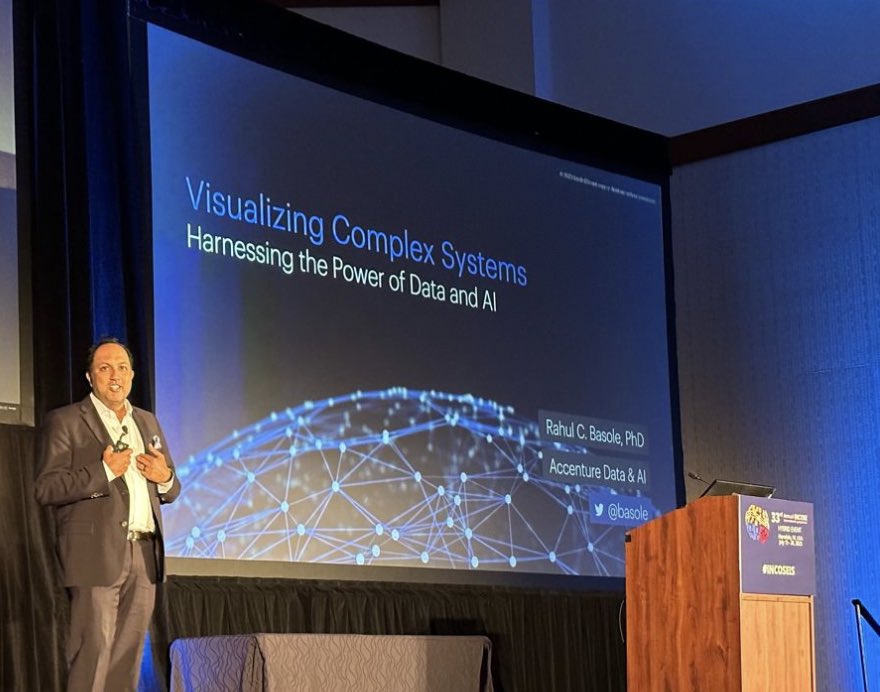
I had the distinct pleasure to keynote the 33rd #INCOSE Symposium in Honolulu today. Thank you @incose_org for inviting me and to all attendees for allowing me to share my thoughts on visualizing complex systems and the power of #data and #AI. It was truly an honor. Mahalo!
Fascinating large-scale study of the economic impact of the AI-powered developer lifecycle. Adoption of #GenAI productivity tools could potentially contribute to a $1.5 trillion increase in global GDP by 2030. @ashtom@marcoiansiti@KeystoneIdeas@GitHub https://t.co/VbVTp7DkLI