New in Claude Code: Code Review. A team of agents runs a deep review on every PR.
We built it for ourselves first. Code output per Anthropic engineer is up 200% this year and reviews were the bottleneck
Personally, I’ve been using it for a few weeks and have found it catches many real bugs that I would not have noticed otherwise
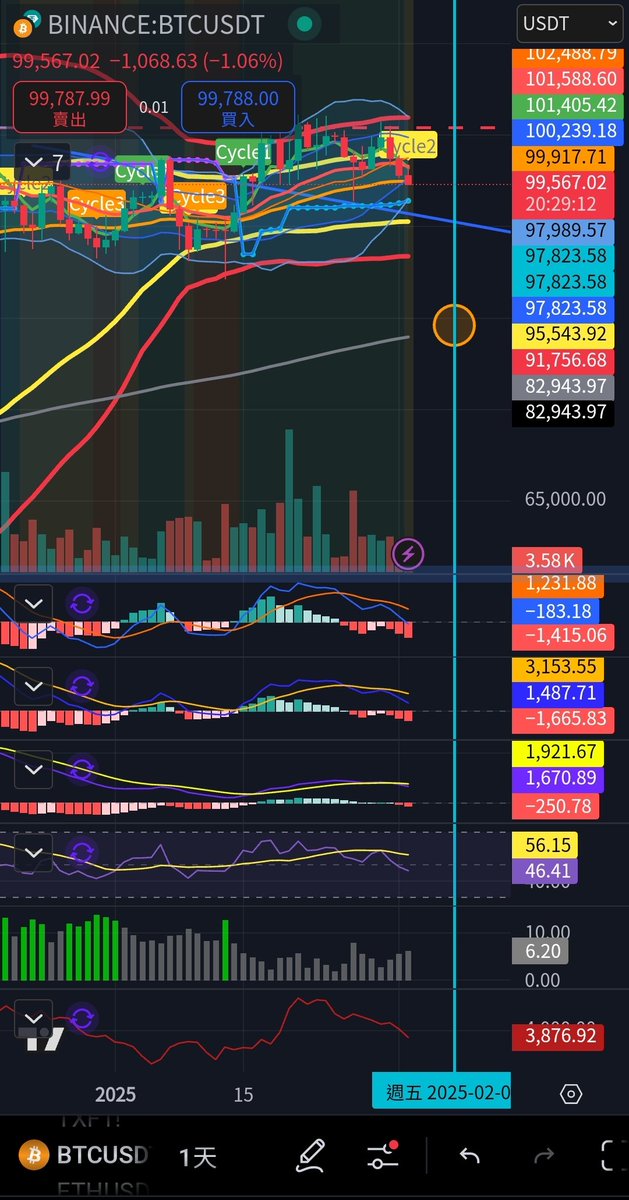
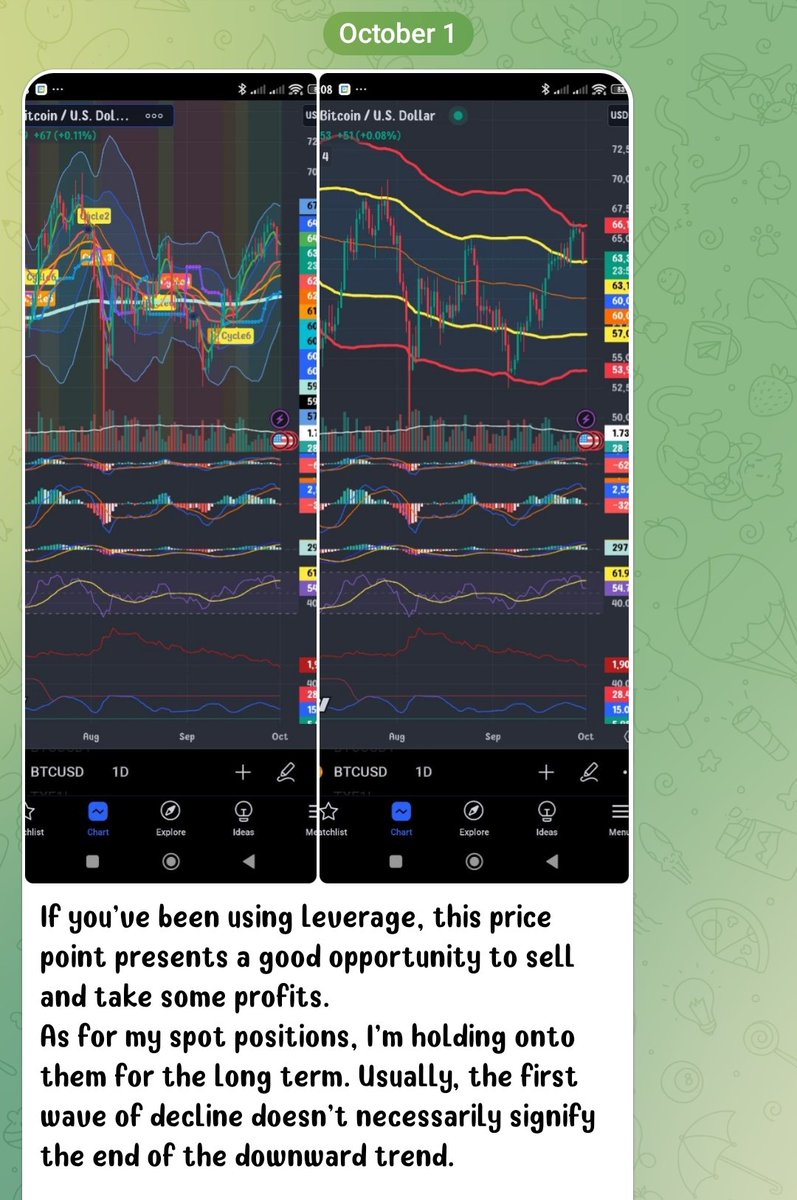
The main players in BTC won't let up until they shake things up a bit. Currently, it's still in consolidation.
In Poor Charlie's Almanack, it's said: "A mental model is a toolbox that your brain uses to make decisions. The more tools you have in your toolbox, the more likely you are to make the right decision."
Our performance won't exceed our vision, and our vision won't exceed what we see and hear. Therefore, what we see and hear can change our lives. I believe that deciding on "good" tools is much more efficient than using old methods. It's like using air conditioning versus a fan when it's hot; no matter how hard you try, fanning won't lower the temperature.
If someone has never used air conditioning, they might not even know it's an option.
Returning to options and the cryptocurrency market, Bitcoin options are an excellent training ground. A few days ago, I bought an NVDA call, and one contract cost around $1,500. If this was a practice trade with a 1% stop loss, we would need at least $150,000 to even practice. This is too high a barrier to entry for most people, so we often see people going all-in. The result is that if the price doesn't exceed the strike price at expiration, all their capital goes to zero.
But in the cryptocurrency market, you can participate regardless of how much money you have. What you need to do is "develop good habits" while trading, and not just go all-in. Use the leverage that options provide wisely to achieve good performance. Once you've practiced with real money to a certain extent, you can move to markets with higher barriers to entry.
If you want to try crypto options, feel free to use my referral links:
Two of the top three global exchanges:
OKX:
https://t.co/m43M29FLMy
Bybit:
https://t.co/2hLXRvmsAy
#NotInvestmentAdvice #JustAPersonalRecord
Feel free to subscribe to my free daily log of Bitcoin market analysis, where I focus on documenting my thoughts and experiences trading Bitcoin and options.
Subscribe to the journal so you don't miss out on future information: https://t.co/gasYgYzTFz
不搞你一下BTC的主力是不會罷休的,目前仍在盤整中。
窮查理的普遍常識中提到:「心智模式就是大腦做決定時所使用的工具箱;工具箱裡有的工具愈多,你就更有可能做出正確的決定。」
我們的績效不會大於我們的眼界,我們的眼界不會大於我們的所見所聞,所以所見所聞改變一生,我認為決定「好」工具比起使用舊方法來說有效率的多,就好像天氣熱了我使用冷氣跟扇子一般,用扇子再怎麼努力都沒辦法使得氣溫降低。
如果沒有使用過冷氣的人或許根本不知道原來有冷氣這個選項。
回到選擇權回到加密貨幣市場,比特幣選擇權是一個很不錯的練兵場,我前幾天下了一個NVDA的Call,一個單位就是1,500美金左右,如果這是一單1%停損的練習單,那我們至少要準備150,000美金才有辦法練習,這個對一般人來說門檻實在是太高了,所以很常看到許多人直接All in,這樣造成的結果就是到期沒有超過履約價所有資金直接歸零。
而在加密貨幣市場,你不管多少錢,都可以參與,你要做的事情就是操作的時候「養成好習慣」不要隨便All in,聰明運用選擇權帶來的槓桿讓自己的績效呈現好的結果,等實盤資金練習到一定的程度再投入到門檻比較高的市場。
如果你想嘗試加密貨幣選擇權歡迎使用我的註冊連結:
全球第二、三大交易所:
OKX:
https://t.co/m43M29FLMy
Bybit:
https://t.co/2hLXRvmsAy
#非投資建議 #僅為個人紀錄
歡迎訂閱免費的比特幣盤勢的每日紀錄,專注於紀錄每日操作比特幣以及選擇權操作的心得
訂閱日記避免未來錯失資訊:https://t.co/gasYgYzTFz
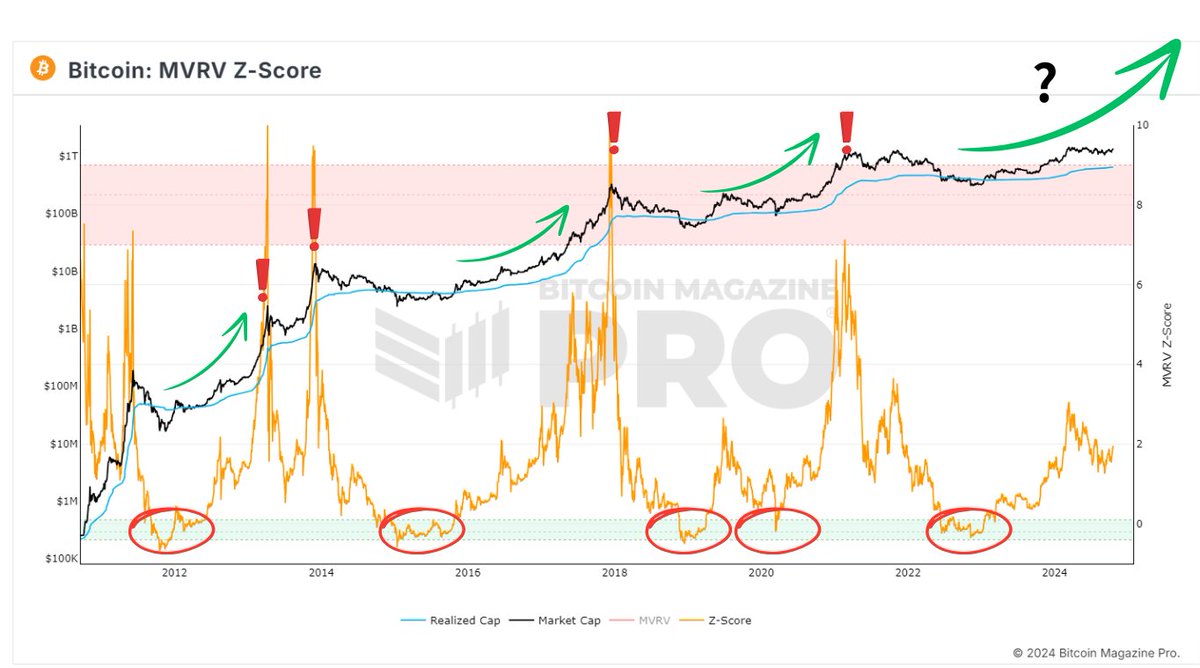
【Has BTC Peaked? The MVRV Indicator Reveals the Answer!】
The MVRV-Z indicator is a tool used to assess Bitcoin's market sentiment and price levels. It combines two key metrics:
Market Value: This is Bitcoin's market capitalization, which is the total value of all circulating Bitcoins at the current price.
Realized Value: This metric is unique in that it references the price of each Bitcoin when it was last moved, not the current price. Think of it as the average cost basis of all Bitcoin holders.
The MVRV-Z indicator is calculated with the following formula:
MVRV-Z Score = (Market Value - Realized Value) / Standard Deviation of Market Value
This formula shows:
Numerator (Market Value - Realized Value): This represents the difference between the market value and realized value. The larger the difference, the more the market sentiment deviates from a "normal" state, indicating potential over-optimism or pessimism.
Denominator (Standard Deviation of Market Value): This standardizes the data, converting the difference into a Z-Score, which allows for comparison with historical data.
Interpreting the Z-Score:
The higher the Z-Score, the more the Bitcoin price may deviate from its "fair value," suggesting a higher risk of a pullback. Conversely, a lower Z-Score suggests the Bitcoin price may be undervalued, indicating potential for upward movement.
You can think of the Z-Score as an "emotion thermometer":
Z-Score above 5 (overheated): The market is overheated, and prices may be in a bubble.
Z-Score between 0 and 5 (moderate): Market sentiment is relatively stable.
Z-Score below 0 (cooled down): The market is depressed, and prices may be undervalued.
Historical data shows that when the Z-Score is excessively high, Bitcoin prices tend to pull back; when the Z-Score is excessively low, Bitcoin prices tend to rebound.
Markets often swing from one extreme to another. Looking at the current chart, this cycle hasn't reached an extreme yet. So, is BTC currently at a high point? Personally, I don't think so.
Historically, the Bitcoin market has experienced significant volatility, with prices swinging between highs and lows. The current Z-Score hasn't reached the heights seen at previous bull market peaks, such as in 2013, 2017, and 2021, where the Z-Score exceeded 7. Currently, the Z-Score is around 4. This could imply that market sentiment hasn't reached extreme euphoria, and there might be room for Bitcoin's price to increase further.
Of course, this is just a single analysis based on the MVRV-Z indicator. The market is constantly changing, and we need to consider other indicators, macroeconomic conditions, and regulations for a more comprehensive assessment of Bitcoin's future trends.
The MVRV-Z indicator can help us better understand market dynamics, but it's just one reference tool among many. Investment decisions should also consider other factors.
The above is just a personal opinion and not investment advice. Please evaluate carefully and DYOR (Do Your Own Research).
🔥 Newbie traders, this one's for you! Master Bollinger Bands to identify optimal buy and sell points and boost your win rate! 🔥
Still struggling to time your entries and exits? 🤔
Bollinger Bands 📈 are a technical analysis indicator that can help you:
Determine price trends and volatility
Identify overbought and oversold zones
Pinpoint the best times to buy and sell
This article 👇 breaks down the principles and applications of Bollinger Bands in simple terms and clear visuals, empowering you to trade more effectively! 💪
👉 Read now: https://t.co/pWQYx9eS6k
#BollingerBands #TechnicalAnalysis #TradingStrategy #BeginnerFriendly #Investing
This chart illustrates the correlation between Bitcoin price and the high-yield credit market.
1.Bitcoin Price TrendsHalving Events and Price Increases: After each Bitcoin halving event (green arrows in the chart), the price generally increases significantly.
2.High-Yield Credit MarketBottoming Out and Rebounding: The red circles in the chart indicate the low points of the high-yield credit market. Whenever these lows occur, Bitcoin tends to start a new upward cycle (red arrows).
Observations and Conclusions
Market Correlation: When the high-yield credit market bottoms out and rebounds, Bitcoin also tends to start a new upward cycle. This phenomenon may reflect changes in market preferences for risk assets.
Let me know your thoughts if you're into this.