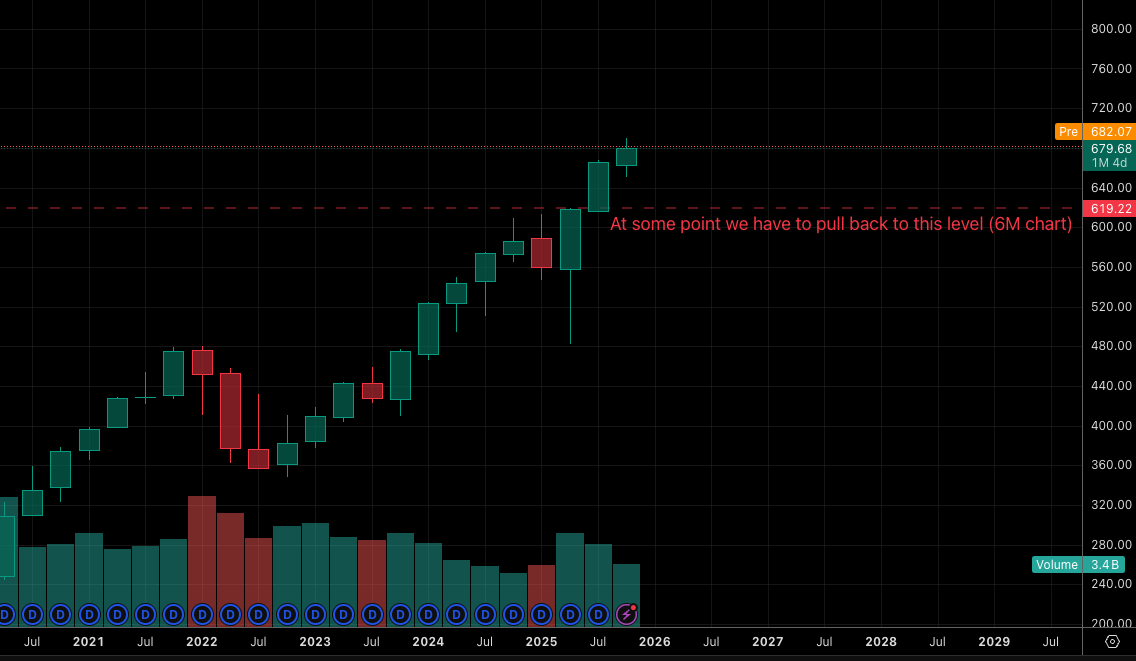
At some point in a few months, probably around summer, $SPY has to pull back to $619. When that happens people are going to call it a market crash. It's not going to be a crash... just another retracement.
@investingluc This is excellent and relatable advice.
I see too many trade plans posted here where they began by spending the first 15 minutes deeply red and I think, “no wonder people have such a hard time!”
@princeFx1b Bingo!
This is what I did. When everyone else said “profitable traders make one trade a week,” I made 100 per day. Some months I burned more than 10 accounts in a month.
You can’t learn without experience. Fail early and often. Get the experience. Then start succeeding.
@richard_mill_ If you know how to read FVGs and OBs, a very high success rate at 1:2.7R can be had.
If you don’t know how to read them, you’re just gambling on a lucky relationship between win rate and RR.
@Macbuiltit@MarketMovesMatt Your 9-20-50 is building a cloud. That’s fine, it can work quite well.
Mine gives me a bit more bias confirmation and protection from chop.
Above both 200 and VWAP = bullish bias.
Below 200 and VWAP = bearish.
Between the two = chop.
Enter/exit crossing 24, when bias.
Consolidation alternates between top/bottom of a zone formed by the bodies (ignoring wicks). At some point, an order block forms completely outside the range then price returns inside. Finally, a candle forms on one half and never crosses the middle. That’s the exit.
Consolidation alternates between top/bottom of a zone formed by the bodies (ignoring wicks). At some point, an order block forms completely outside the range then price returns inside. Finally, a candle forms on one half and never crosses the middle. That’s the exit.
This $SPY 751 target will be reached. Looks so ready that it may actually come overnight or in premarket.
New, tentative $SPY call target for tomorrow is 754.
@CHATLOLL@AndrewTradesNQ The algorithm is fractal, meaning that all the same things happening at this scale are also happening *inside* of every candle! Once you understand that, you can see a single candle and actually know what that means to the larger narrative.
@CHATLOLL@AndrewTradesNQ At this scale, all you can see is that it’s taller than the candles to the left and right of it (and that is enough!), but if you zoom in to a smaller timeframe, you will inevitably find that it is a breaker block. Once it was passed, price was clear to rip.
I didn’t start this account with the intent of exposing how much lying and disinformation and nonsense is pushed by the 𝕏 trading community, but I guess that’s what it’s becoming.
@nypost I’d be perfectly okay with this from a random fan, but I see why a “trade group leader” should probably not be insulting possible trade partners, especially when there’s really not even a decent punchline!
@DenizTheTrader What are you journaling? Are you writing down the market structure? Drawing the past 30 candles? Time? Weather? Trump tweets? Correlated assets? Emotion? How well you slept? Blood/sugar levels?
You people are full of crap. Journaling is nonsense. Stop wasting your time.
@rushicrypto Problem: We’ve outsourced all real work, so the only thing produced domestically today is healthcare.
Solution: Repatriate production so there are real jobs. Then you can fix healthcare without crashing the entire economy.
It’s coming.