@benjamincowen Its ok honestly, most of the crypto twitter influencers where wrong about almost every call they made. At least with you we didn’t loos money, just didn’t get the exact bottom, not that big of a deal.
@Rendoshi1 He pretty much helped all of us to make more money than most of crypto twitter, why do you hold him to such a high standard but dont hold anyone else to the same standards? Make it make sense 🤦🏻♂️🤷🏻♂️
The bond market situation is crazy.
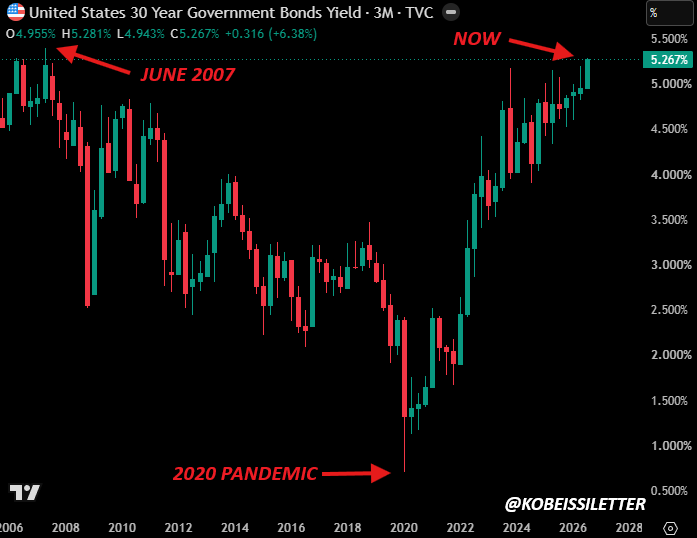
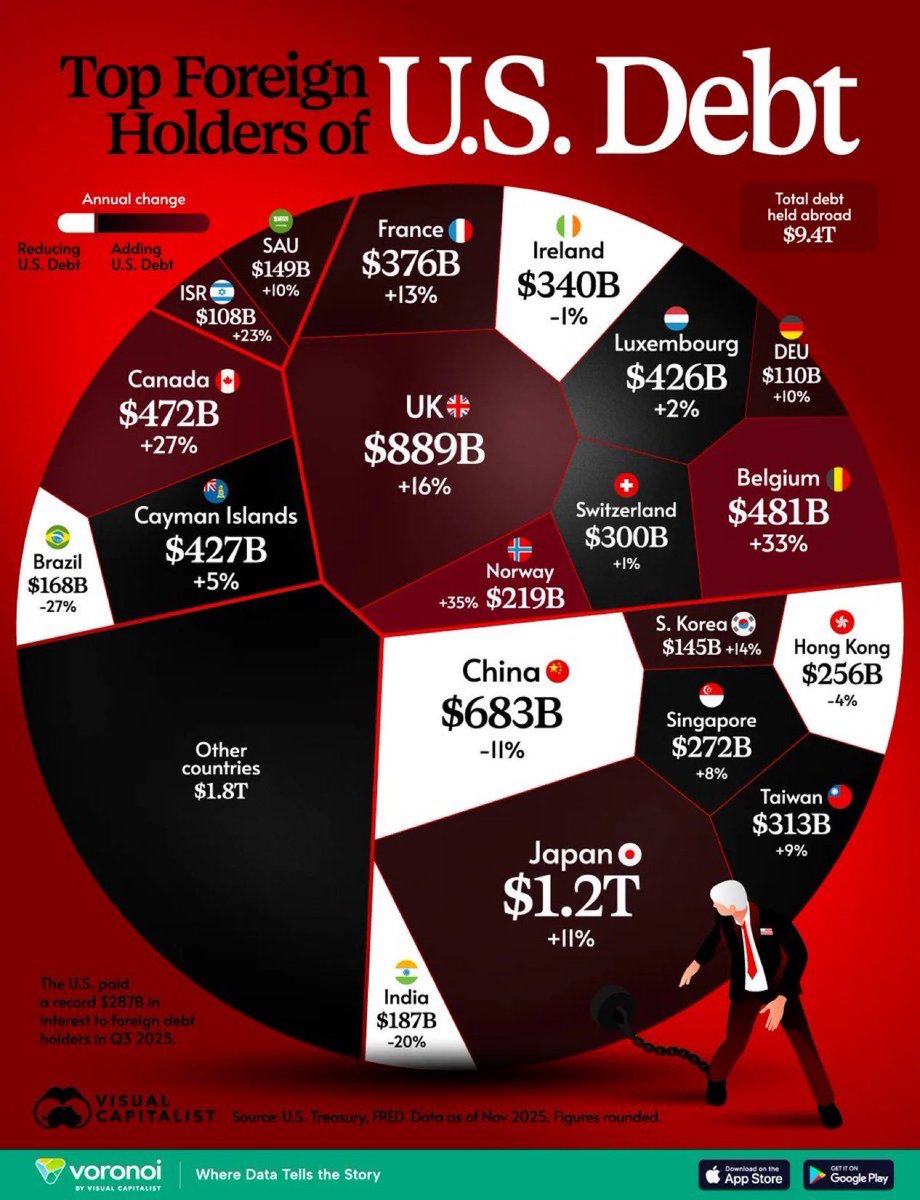
While everyone focuses on AI, US borrowing rates just hit the highest level since June 2007.
Credit card "serious delinquencies" are at the highest since 2010 and mortgage rates could near 8%.
What's happening? Let us explain.
(a thread)
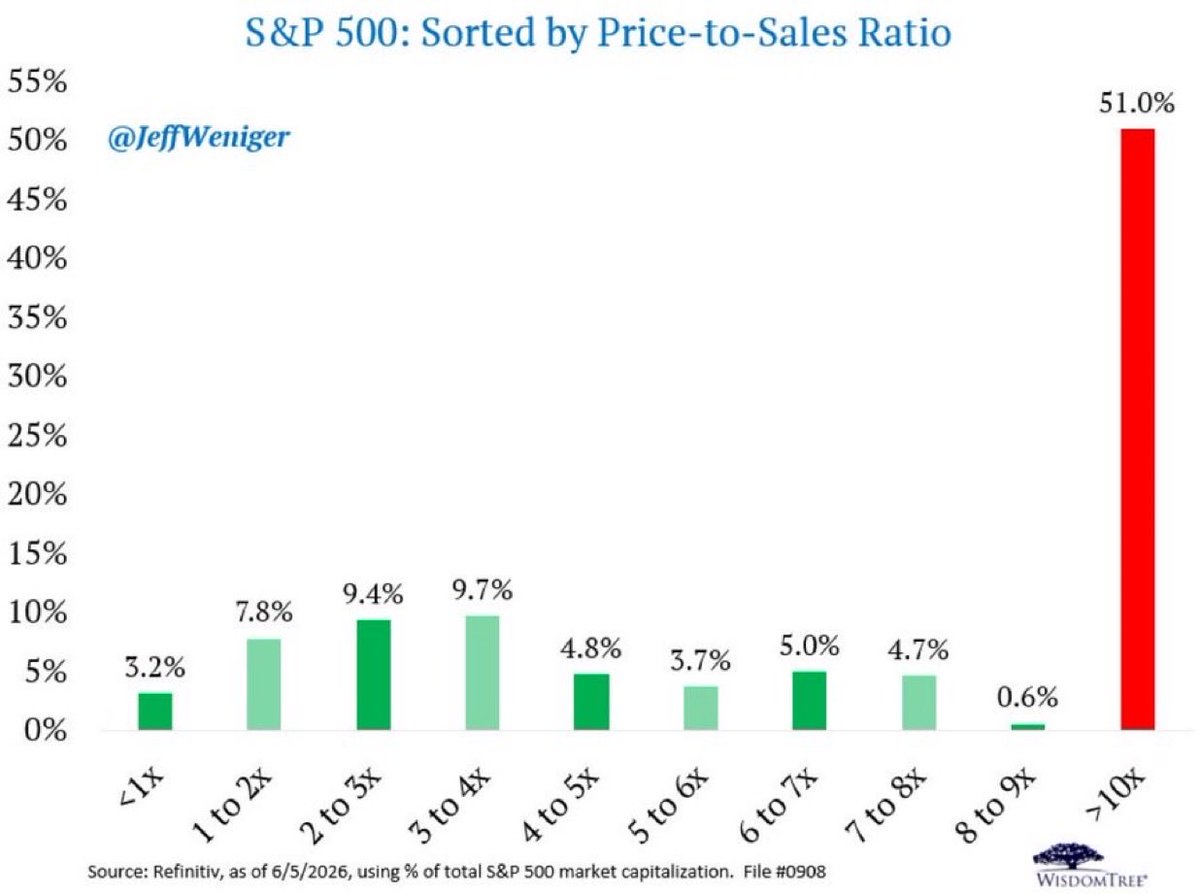
51% of the S&P 500's market cap is in stocks trading above 10x sales.
Half the index.
In 2002, after Sun Microsystems crashed 90%, CEO Scott McNealy famously said this about his own stock at 10x sales:
"At 10x revenues, to give you a 10-year payback, I have to pay you 100% of revenues for 10 straight years in dividends. Zero costs. Zero R&D. Zero taxes. Zero employees. What were you thinking?"
He was explaining why investors had been insane to pay it.
Today, half the S&P 500 trades there.
Different decade. Same math.
The performance gap within tech stocks is at historic levels:
The top 20% of US tech stocks have outperformed the bottom 20% by ~120 percentage points over the last 3 months, the 2nd-highest reading in history.
By comparison, this difference peaked at ~135 percentage points during the 2000 Dot-Com Bubble.
This spread has QUADRUPLED over the last year, outpacing the surge seen in 1999-2000.
Top 20% of tech stocks have now returned +110% over the last 3 months, nearly matching February 2000 levels.
At the same time, the bottom 20% performers have returned -10%.
The tech rally has almost never been this concentrated.
Unemployment rate rising
Geopolitical conflicts rising
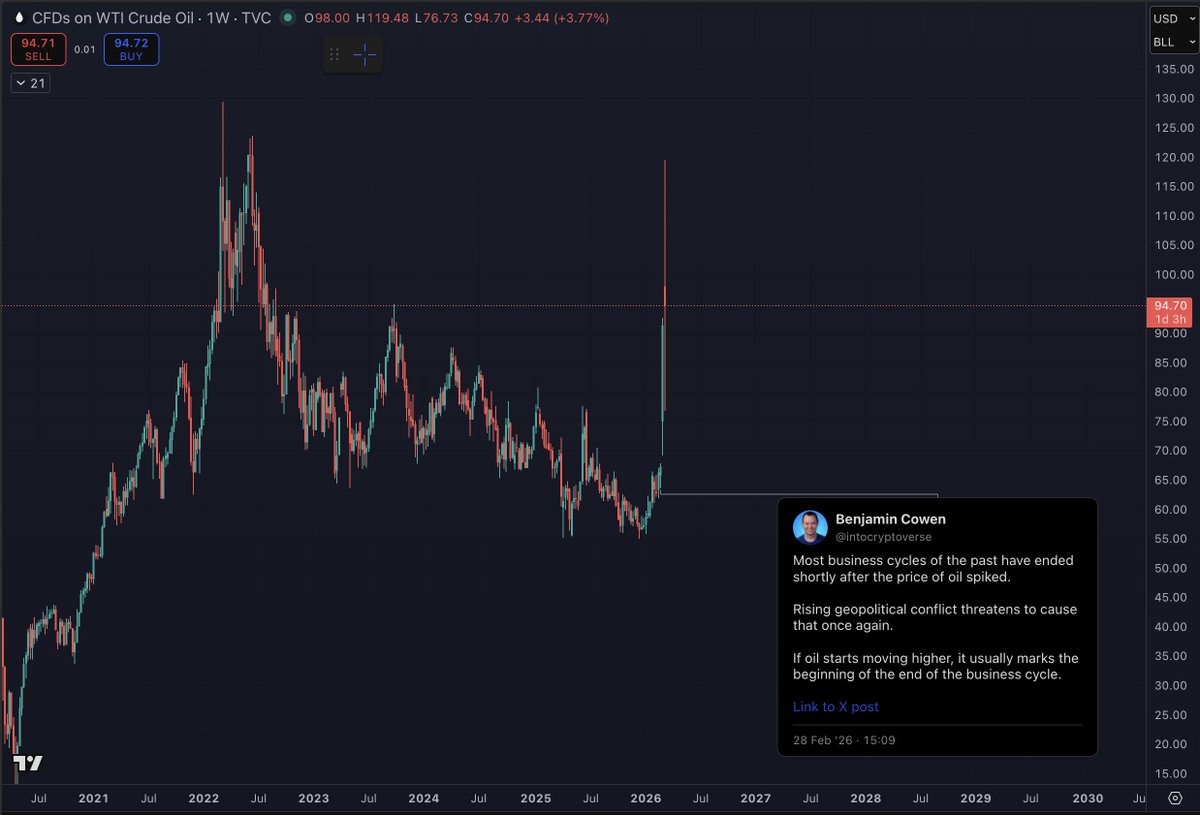
Price of oil rising
Inflation rising
Airport travel collapsing
Bitcoin dropping
Stocks dropping
All business cycles must come to an end, and it usually ends with a recession.
The reason this four year cycle top for Bitcoin "feels different" is because this is the first major top BTC has had during a late business cycle environment.
It explains why there was no alt season, why BTC has been bleeding to SPX, and why SPX has been bleeding to Gold.
We got a glimpse of this type of environment in 2019 but then the pandemic causes a crisis which reset the business cycle. It also happened during the middle of a four year cycle for BTC, rather than at the end of one.
This cycle has been more brutal because there has not <yet> been a crisis to allow the business cycle to end and for things to reset.
So the business cycle keeps on limping along while high risk assets continue to bleed out to lower risk assets.
And realistically we should not expect that trend to change until the business cycle ends.
$625k home
20% down-payment
$500k mortgage
With a 6% interest rate and a 30-year term, you are paying $579,190.95 in interest.
The $625,000 house cost you $1,204,190.95.
This is equal to a $3,345 monthly rental payment, plus you pay for maintenance and repairs.
Houses cost so much because people can borrow money that's created with the press of a button to buy them.
If everyone had to pay in cash for their home, prices would drop significantly.
Most people think mortgages are designed to help them.
But NO.
Mortgages are designed to earn profits for banks.
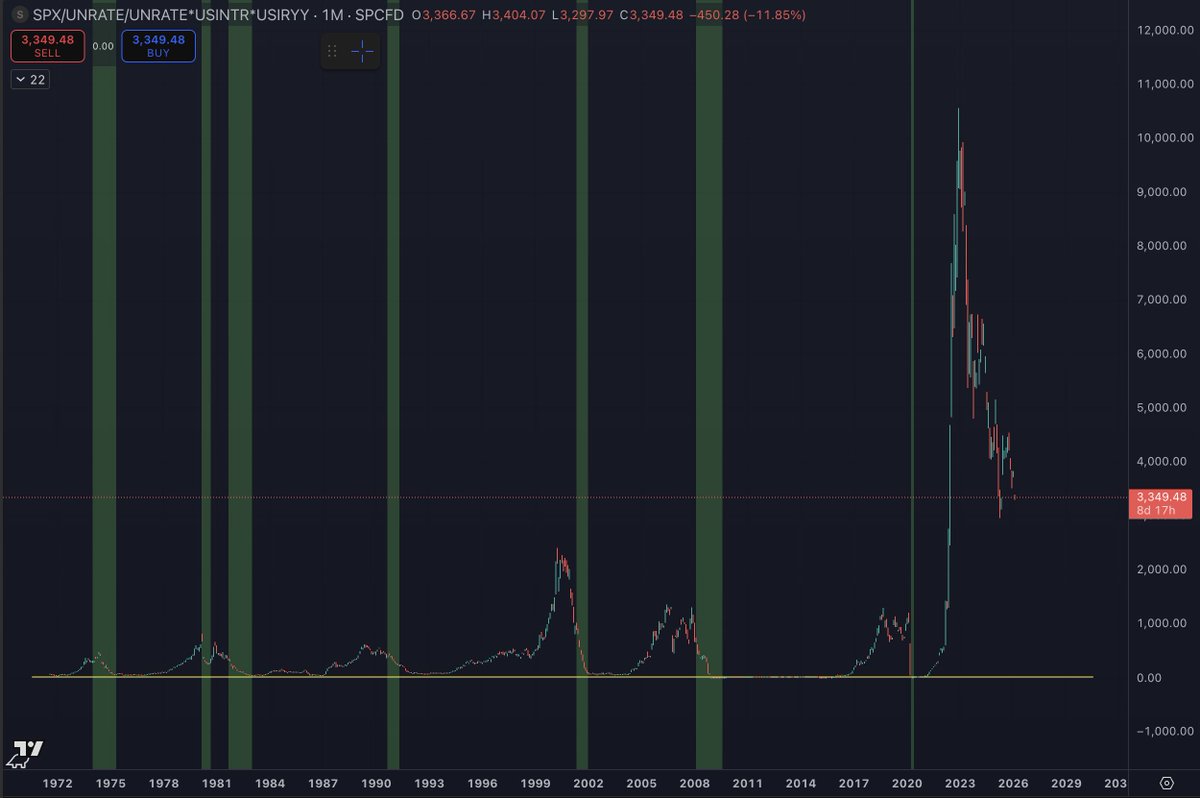
I have mentioned this chart a few times in the past, but it does really go to show just how extreme things got the last few years.
The chart is SPX/(UNRATE^2)*USIRYY*USINTR
Unravelling things after extreme euphoria is never an easy process.
As things have been unwound over the last several years, most markets have gone higher on hopes of a soft landing. But there has generally been a flight to quality within each asset class as people buy what they better understand and think has value long-term, rather than short-term speculative investments.
Unwinding euphoria has never been an easy or a fun process, but it is a process we have been going through for the last several years.
As liquidity and monetary policy has stayed relatively tight the last several years, it has led to a general flight to quality within each asset class.
This is why BTC outperformed most other things in crypto and why the MAG7 generally led the S&P 500.
Starting out far on the risk curve, altcoin weakness was observed first as they bled to BTC for years.
Then as the BTC bull market came to an end, BTC was noticeably bleeding to SPX.
Then it became apparent that SPX was bleeding to Gold (which it already had been but more people started to notice).
Notice how we are basically just working our way down the risk curve?
As this chart falls back down to prior support levels, it represents us going back to normal times.
What I love about this chart is that you can clearly see each business cycle and how every single one of them ended in a recession before the next business cycle began.