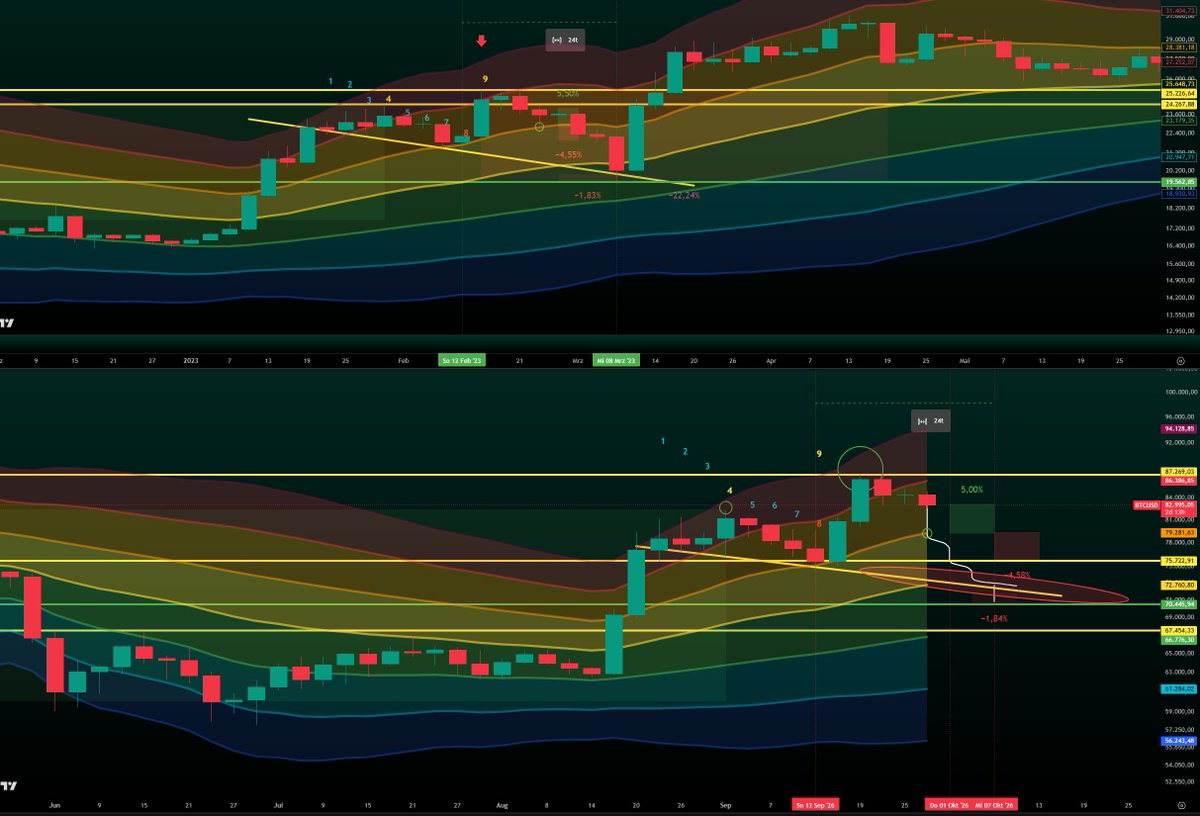
Nailed 🔨
I have shown you the perfect path for Bitcoin for months.
I called the local top, and I expected the first low for today.
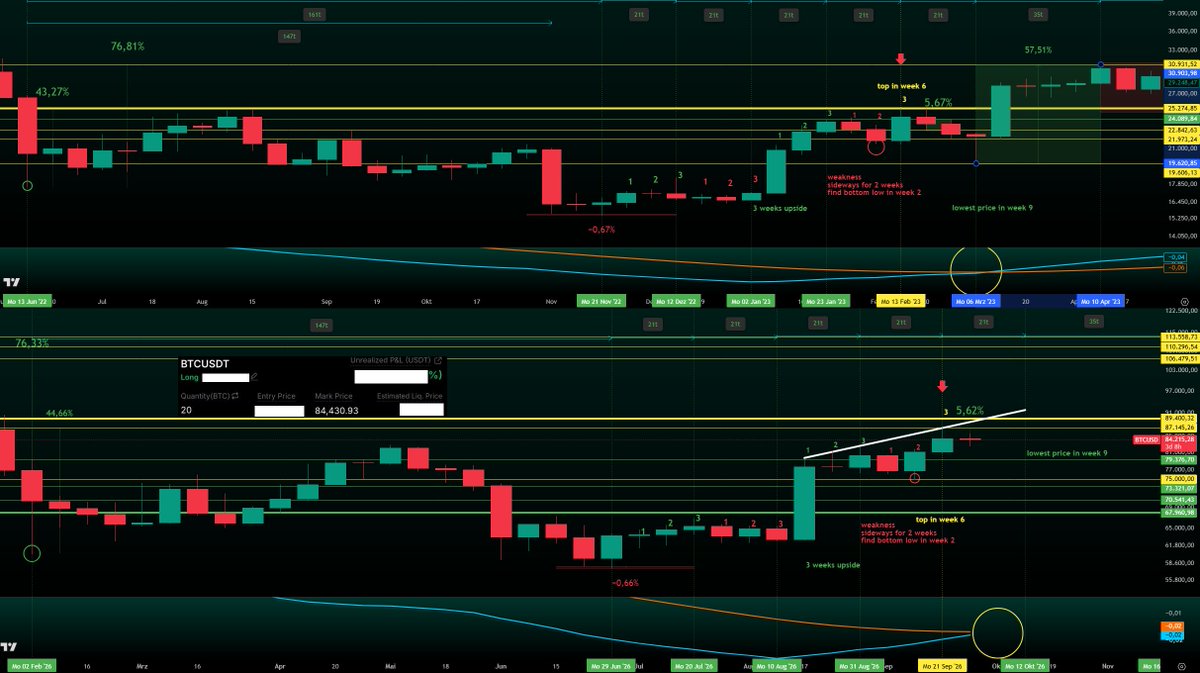
We should see the low in week 9, next week.
What I expect now is a pump of at most 2–4%.
I expect this week’s low to hold before Bitcoin builds liquidity over the weekend and drops one last time next week, before heading toward $94,000–$99,000 in November.
It is no longer time to be bearish.
I have built my swing long and am already 33% invested.
I still expect one last correction by October 15 at the latest, which will make the newly arrived bulls feel like we are going lower.
The noise will be loud and the crowd will demand lower prices again.
That is exactly when I expect the violent short squeeze.
If that thesis holds, I expect the lowest price (and I will not bet on it) will be between $78,000 and $79,000.
After we see prices above $90,000 in November, I expect the lows we reach today and next week will not be seen again, and the upper $80,000s will become support.
Valhalla Pump is coming soon. ⌛️
bitcoin:native
🚨Literally "BREAKING" News🚨
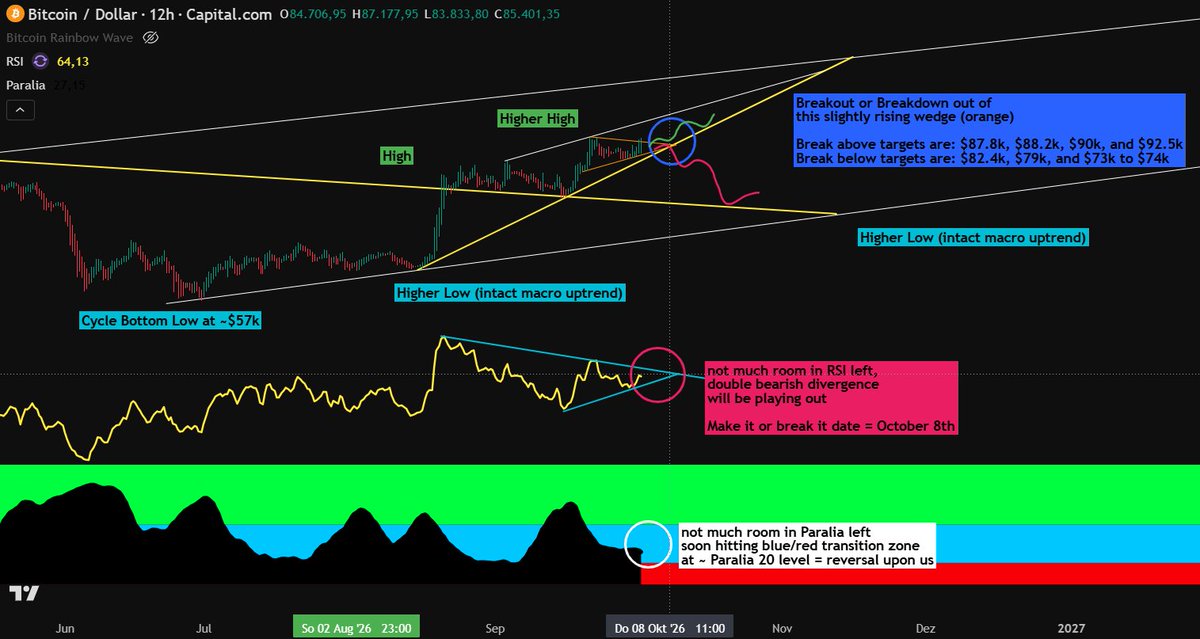
We are right now in the middle of breaking down our macro uptrend we have been establishing since August 2026. I predicted this move back last weekend in my #ShortTermSaturday update. Make sure to check the attached post below. 👇
🍿Today, I herewith want to let you know that the trendline has been broken to the downside, even one day before my inital first "make it or break it" date which I publicly scheduled for October 8th - 10th to be happening. This implies temporary weakness in $BTC but definitely neither an end of the macro uptrend starting in June 2026 nor a lower low to be established. It's just a healthy pullback that is upon us.
Yet, my downside targets remain the same:
- $82.8k (super short term)
- $79k to $80k cluster (sweet spot at 0.786 fib)
- $73k to $75k cluster (worst case scenario around 0.618 fib)
- $71k (black swan ultra "deep" setback scenario at 0.5 fib)
Make sure to brace yourselves for further moderate downside and we will come back to it this Saturday again.🔮
Enjoy the ride, fellas!🎢
Sheriff🤠
On vacation, so keeping it short.
Bitcoin failed to form a higher high.
I expect a test of 84.4k first.
A break of that level puts 80–82k in play as the next target.
Invalidation, if Bitcoin prints a new high this week.
bitcoin:native
#ShortTermSaturday Episode 2 (10/03/26)📈
✒️My dear followers,
I have been astonished by your feedback and the resonance my first #ShortTermSaturday post has brought me in. I think, I really hit the nail in the coffin by providing and including short term outlooks for $BTC to you - in the end, as always it's supply and demand. You demand it, I provide it and the supply is super-rare info and data you will only get on my X or on my dear friend's X account @xapa03. So make sure to follow him too! 🤝
🤿Let's dive into today's #ShortTermSaturday, shall we?
1) Meso-perspective wise, we are still in our rising wedge structure on the daily time frame. A rising wedge per definition is an overall bearish setup with a high tendency of breaking to the downside rather than breaking to the upside. By breaking down, I clearly do not mean a blood bath, it's just simply a cool down the market needs every now and then in order to reset its momentum oscillators and to find a higher low foundation to build the next big long move on. So for the daily timeframe speaking, neither RSI nor Paralia have plenty of room left to go upwards or to run even hotter. RSI will end up in a double bearish divergence with two higher highs in price and two lower lows in RSI which will clearly break down. Paralia is close to being red, and you know what that means. ⚠️
2) Our "make-it-or-break-it" range will be October 8th to October 11th timewise. In this span, it's decision time. If I had to make a hard guess, I do see a break to the downside and with that, an RSI breakdown, a Paralia rise-up to the green and a $BTC price rangebounding in the cluster of $74.5k to $79k. If Bitcoin was to end up in this range, RSI would be cooled down, Paralia would again be green on the 12h to daily timeframe (long swing entry signal), and $74.5-$79k would be a solid consecutive higher low structure that would define and solidify our uptrend form our bear market bottom low at $57k end of June (@xapa03 and I called it to the tee btw). 🚨
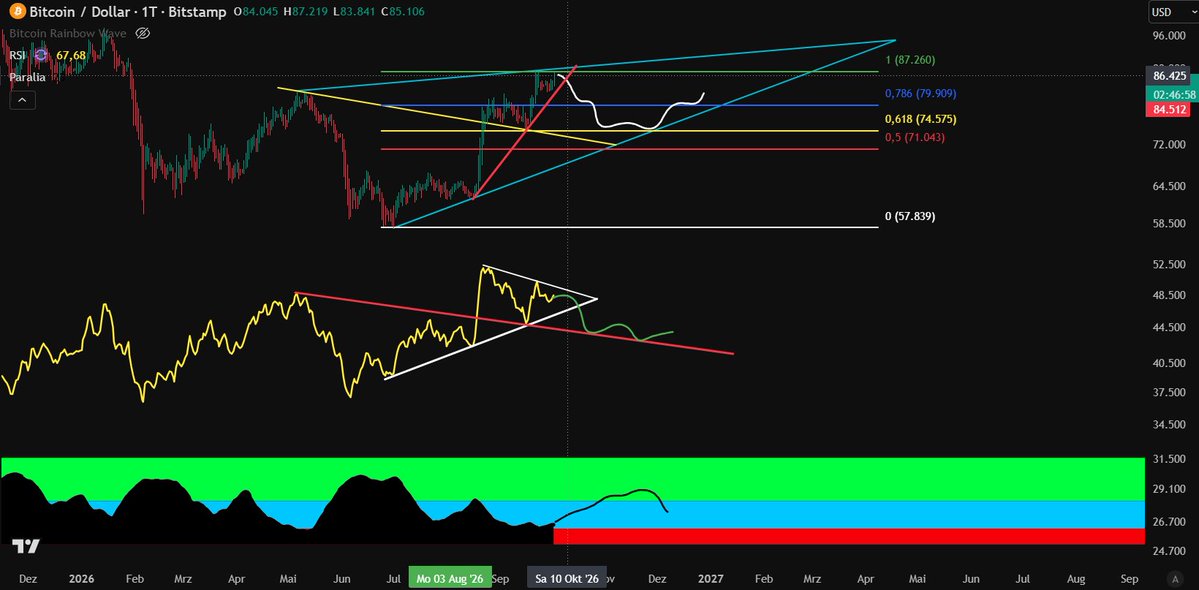
3) To crown the first two pictures in my analysis, I overlaid a Fibonacci price grid starting from our bear market bottom at $57k in June 2026 and going until Bitcoin's last range high at roughly $87k ish this week. We can see that .618 and .786 would be the two perfect sweet spots where Bitcoin could be rangebounding and "breaking down" into, finding higher low support with the macro trendline (blue) coming all the way form the June cycle bottom. 👑
🧮If we extrapolate all numbers, we would end up with the following prices:
- $BTC has seen its final high for this range at roughly $87k-$88k
- There's a modest but not big chance of maybe finding ONE HIGHER HIGH ($89k-$90.5k) which I would not bet on and I would not trade on from these prices
- Eventually, $BTC will break down of the rising wedge and at least revisiting the $79k-$80k cluster with a high likelyhood and a textbook sweet spot turning point at roughly the $74k-$75k cluster
- breakdown date would be mid-October and IF IT WAS TO BREAK DOWN, we would see $BTC sub $80k in late October to early November
Stay tuned for fresh weekly data on #MomentumMonday and next week's short term outlook. 🔔
Thanks for tuning in and enjoy the weekend!☀️
Sincerely🤜🤛
Sheriff
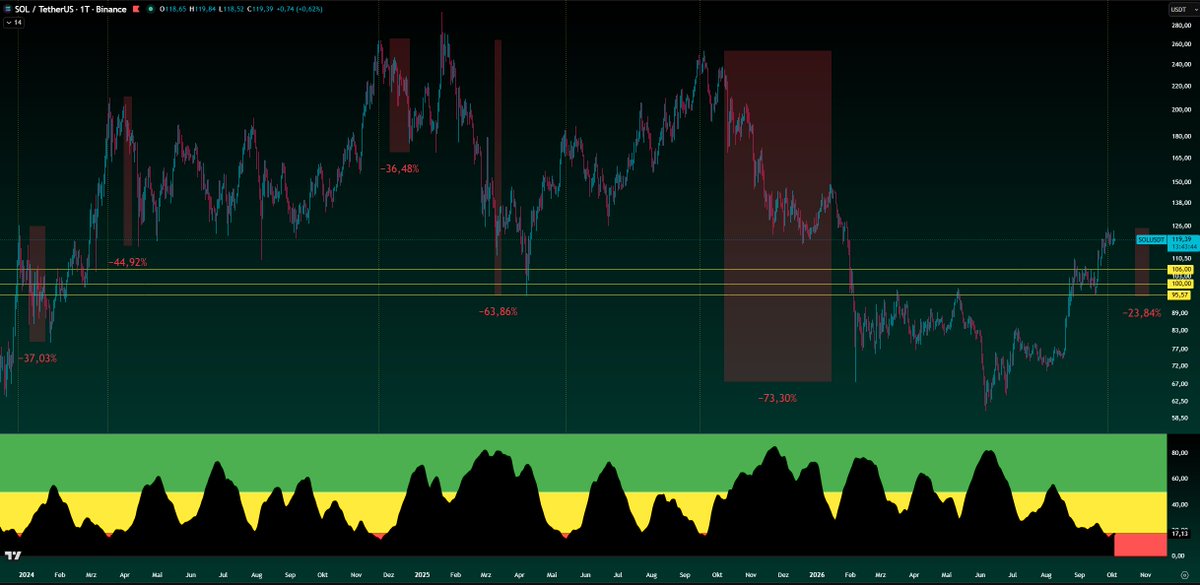
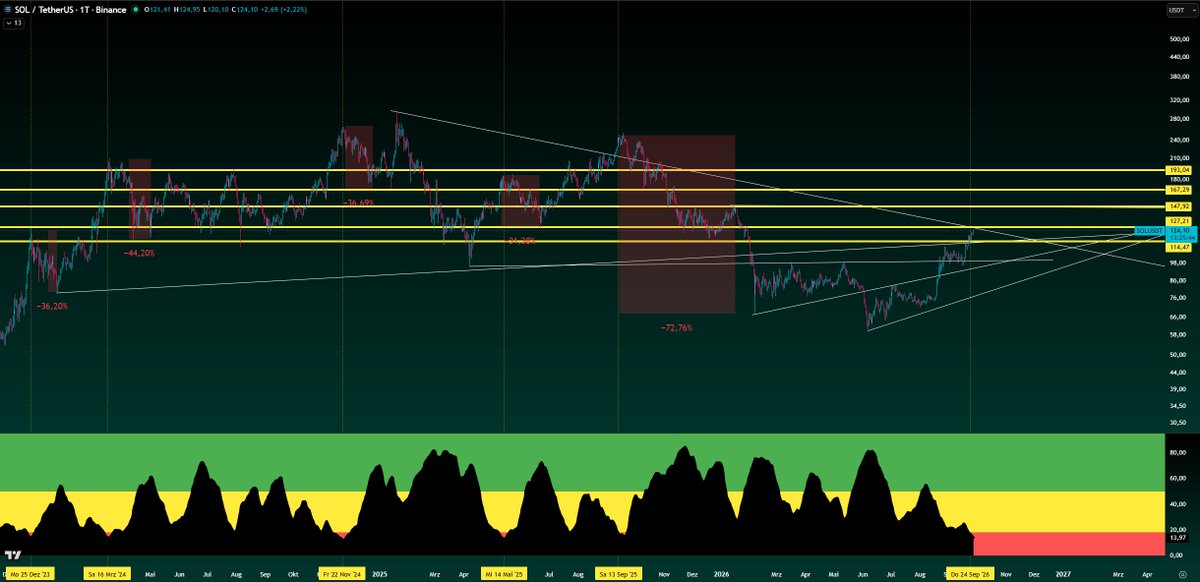
Measured from the last candle in the blue TEM zone, Solana needed 17 days back then until it first touched the yellow zone.
After that it found its last local bottom 71 days later. From the last candle in the green TEM zone it then took 39 days to the top, and that was roughly 68%.
We’re seeing the exact same setup in 2026.
Candle in the blue TEM, 21 days later the first touch of the yellow zone. After 66/69 days came the local bottom and from the last green TEM candle we’re up around 68% again.
All in all it’s 110–111 days from the last relevant TEM zone to the top.
SOL entered also the overheated zone on the higher timeframe, a rare sign that SOL is about to see a huge correction.
The second picture starts from 2023 and ends in 2026.
solana:So11111111111111111111111111111111111111112
Measured from the last weekly candle inside the green zone of the TEM, ETH found its peak within 35 days.
The top occurred exactly after 35 days (on the weekly timeframe), and the attempt to break out that week resulted in a lower high.
The first level I see for Ethereum is $2,500, with a maximum pullback to $2,200.
I expect market weakness over the next two weeks and for Bitcoin to drain liquidity from most altcoins.
I also showed patterns for Solana and Bitcoin that predicted the tops.
As long as it hasn't been invalidated, it remains valid.
Could it be that simple?
ethereum:native
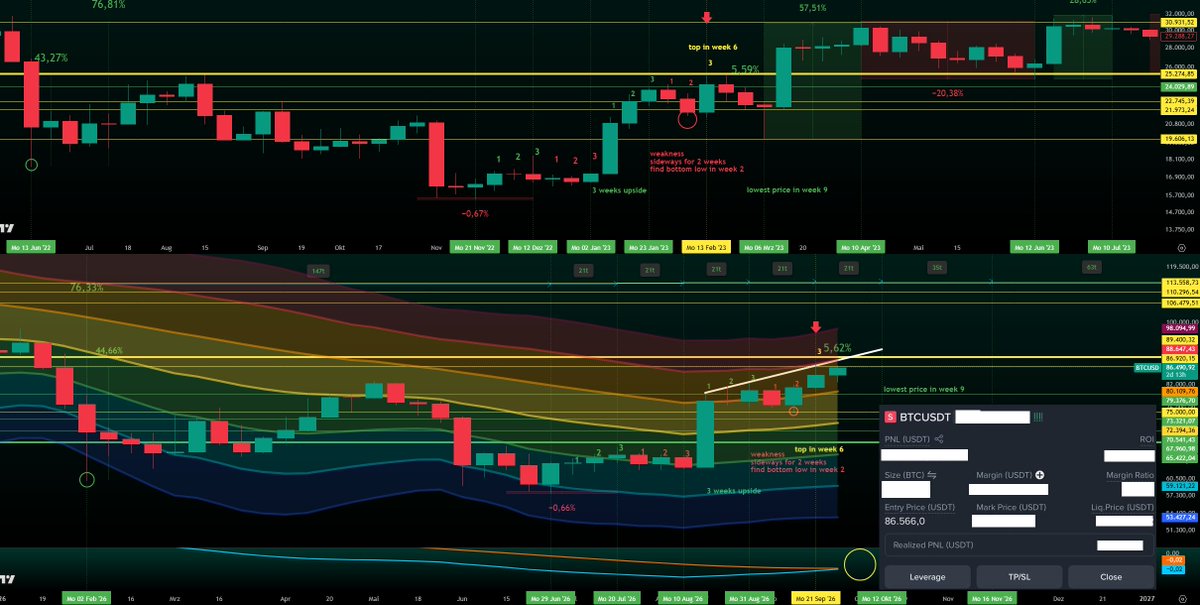
Bitcoin rejected after a 5,6% pump, exactly like 2023.
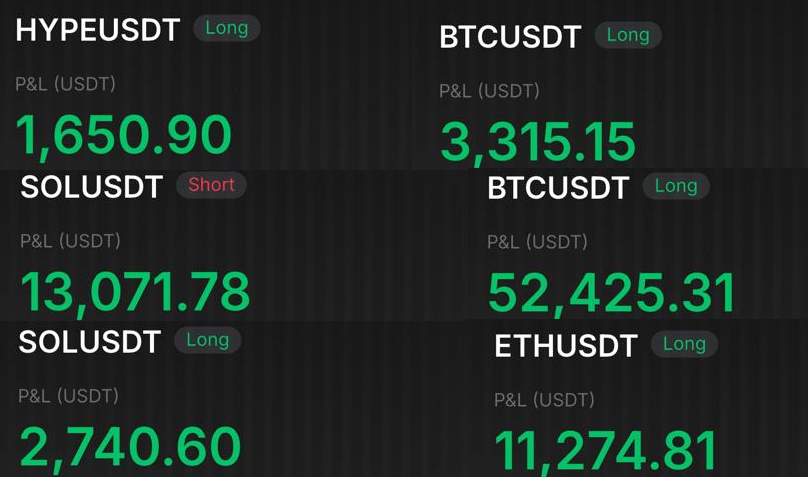
A clear reason for me to enter the short trade and close my long positions.
I am very bullish and i will start to build my swing long position soon, because i expect the bullish crossover between 5.10 and 12.10. ⌛️
Clean entry, clean exit.
Do not miss any live trades and join XAPA's WORLD
https://t.co/6atyr1dSg7
bitcoin:native
The HTF weekly pattern has played out exactly so far. Drawdowns are clearly smaller, so I don’t expect Bitcoin to go below $75,000.
I’m extremely bullish, but rational!
First the area around $87,000 has to be taken.
Once that’s done, the path almost inevitably leads toward $89,000, with momentum up to $91,000, where I expect a rejection.
Once that happens, I expect the low in the week 9.
A higher high above $87,300 would completely change the read on this pattern and would have to be treated differently.
After all this unnecessary noise, Bitcoin will rise toward $100,000 and print a new all-time high by next year.
I’ll close the 20 Bitcoin long between $87,000 and $89,000.
The chart says more than 1,000 words.
Every dip is an opportunity, a serious one.
This is a gift for our future. 🌹
bitcoin:native
Lately I lost the plot, I stared at one pattern instead of the full picture.
The pattern looks clean, I know.
But I don’t think it plays out 1:1.
And before that mistake snaps my neck, I’m going back to my roots.
Starting today I’m posting clean TA.
I update every trade live.
That’s also why a lot of people miss it, if you’re not watching in real time, you don’t see the whole thing.
No more tunnel vision.
Just the work!
When I hit 35,000 followers, I’ll give away $3,500 to 35 people ($100 each).
To enter, you need to comment, like, and share this post, and Grok will select the winners!
Thank you for the incredible support!
EDUCATION ONLY, NFA!
Welcome to XAPA's World!
https://t.co/6atyr1dSg7
I’ve been mapping this HTF pattern onto the LTF for weeks now, with very high precision.
Delays can still happen because this is an HTF pattern on the weekly timeframe.
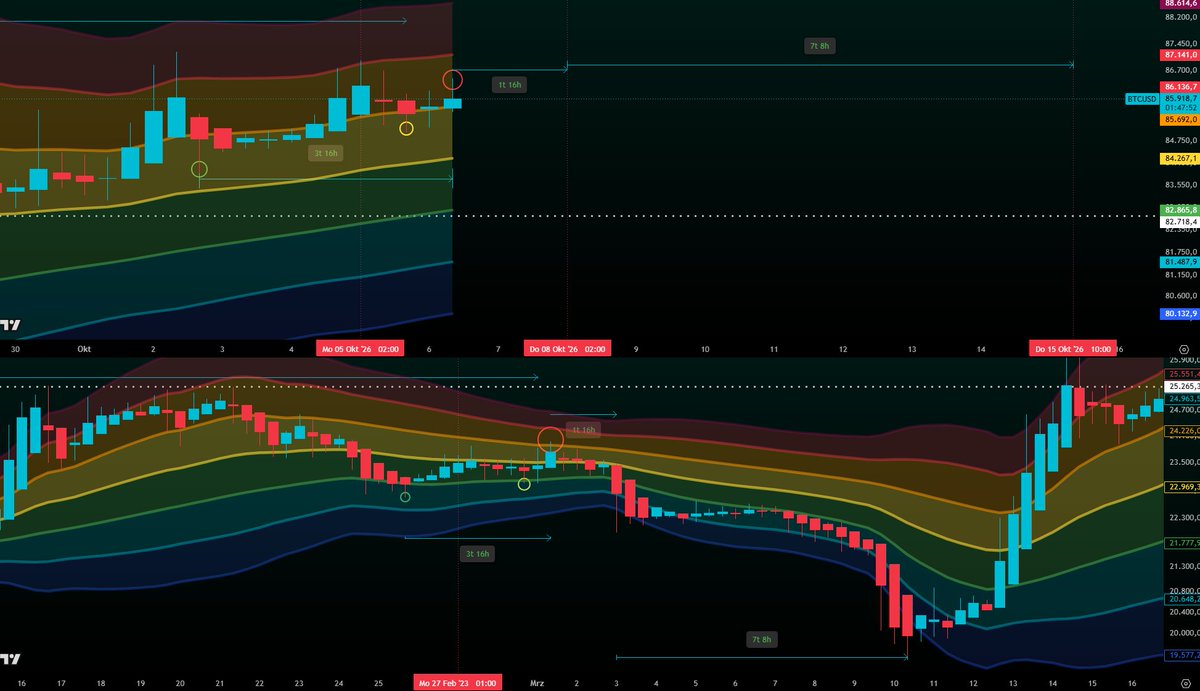
After I said Bitcoin would reach the $84,600–$85,600 zone and get rejected there and it played out exactly that way, I want to explain why I thought that and what I expect next.
Measured from the number 8 (you see the pattern on the 8H timeframe, but the overall pattern in this video was drawn on the 3D timeframe), one day before the breakout, it took 24–27 days for Bitcoin to find its low.
Bitcoin still needed a maximum wick into the orange zone between $84,600 and $85,600.
You can see that in 2023 the wick into the orange zone happened, and the next 8-hour candle pumped only 0.41% and got rejected below the orange TEM zone.
You can follow the rest of the move in the video.
The same scenario played out again today.
Exact wick into the orange TEM zone, then the next 8H candle started bullish with a +0.40% pump and got rejected below the orange TEM zone.
$85,600 was hit, euphoria kicked into the market, impatience got punished, and late longs are now trapped.
If the pattern continues to play out on the LTF with the same high precision, I first expect a drop to $82,300, followed by another drop toward $80,000.
If it plays out that way, I expect a wick above the orange zone once again, before it drops further towards the $79,000–$75,000 range.
It’s not the time to be bearish.
Bitcoin looks extremely strong, the $82,000–$83,000 zone is holding beautifully.
I still expect Bitcoin to drop below $80,000, but I’m not betting on it.
I’m preparing for the next brutal pump and will start building my swing position.
Because the TEM zones move with price and levels can shift, the targets can change as well, I’ll keep posting daily updates.
It doesn't necessarily mean it has to happen again!
Since this is a high-timeframe (1W) pattern, delays or deviations may occur on lower timeframes than 1W.
According to the pattern, on the 3D timeframe, Bitcoin could be at $79,300 by Wednesday, a dump into month-end and quarter-end.
If Bitcoin sells off into the month-end close, I expect a 5% pump afterward, followed by a move down into the $75,000 zone, thats the pattern.
I expect Bitcoin to hold the $75,000–$79,000 range before heading toward $90,000-$106,000.
That’s why my first long entry is at $79,500, not at $79,000 anymore.
If the pattern repeats, it would look like this:
Dump into Wednesday toward $79,000, then a 5% pump within 3 days into October 4.
From October 4 to October 7, a final red 3D candle, then the move toward $90,000-$106,000.
Otherwise you can see on the chart what the maximum lows would be if the pattern repeated 1:1 on a percentage basis.
I’m not betting on that exact copy.
I’m betting on the $75,000–$79,000 range.
My longs will be larger than my shorts.
If we keep falling, I’ll add more to the long between $75,800 and $68,000.
bitcoin:native
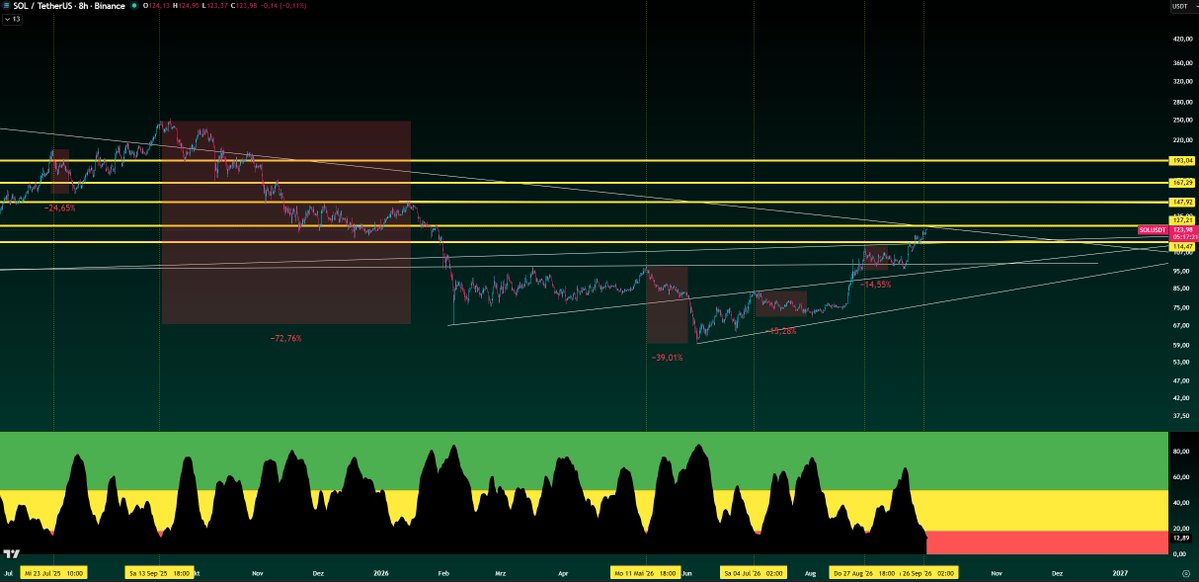
SOL entered the overheated zone on the higher timeframe, a sign that SOL is about to see a huge correction.
For me, 124$–130$ is the short zone with 3x leverage.
" We’ve either dropped right around the moment the black bar entered the red zone, or we’ve been stuck in the overheated zone for multiple days, which causes the black bar on higher timeframes to slide into the red area as well. "
solana:So11111111111111111111111111111111111111112