🚨 NEW | Wales accounts for HALF of all modelled UK abandoned mine methane emissions, yet official government data shows ZERO active methane capture projects.
The UK has 16 known operational sites. Wales has none 🧵1/4
https://t.co/OPrHcpM3so
@Point_of_Gold@ember_energy The 89% refers to the share of global CMM emissions left unreported, not the share of countries. Because the 50 non-reporting countries include China, India, Indonesia and the US, the emissions gap is much larger than the country count gap.
⚡ NEW: Super excited to share my first Ember report, and Ember's first Global Coal Mine Methane Review! 🌍
All the data is freely accessible via Ember's Coal Mine Methane Data Tracker 📊https://t.co/QOPehHTPUd
🤝 Huge thanks to everyone who contributed to this work!
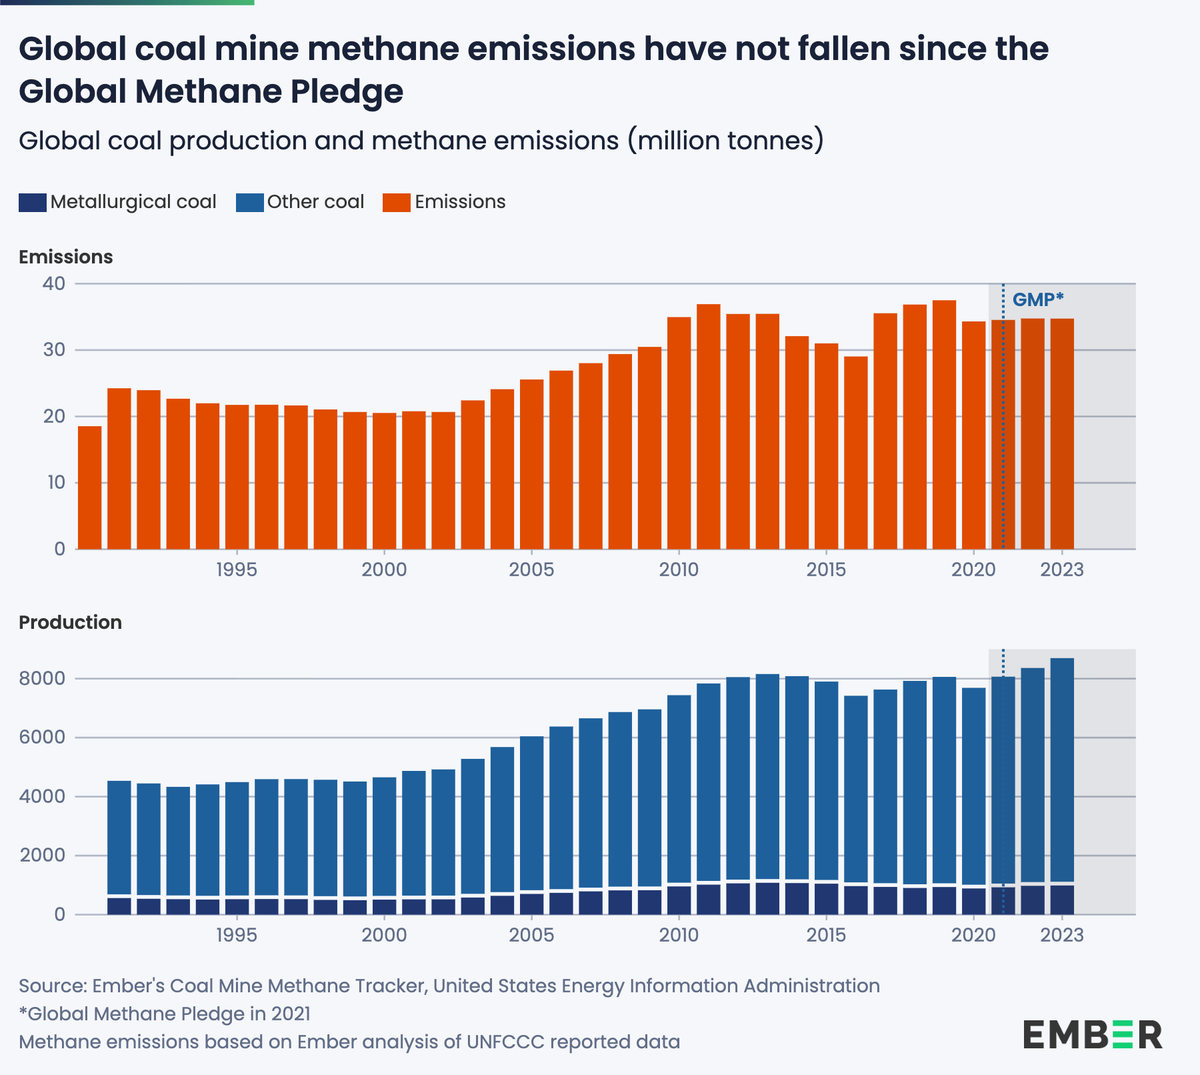
NEW | Global coal mine methane emissions have NOT FALLEN since 2021, despite rising coal production.
Only 23 of 73 countries reported #CMM emissions, leaving 89% UNREPORTED.
Yet, existing tech could cut #CMM by MORE THAN HALF.
https://t.co/F5BURGSfwH
NEW | Global coal mine methane emissions have NOT FALLEN since 2021, despite rising coal production.
Only 23 of 73 countries reported #CMM emissions, leaving 89% UNREPORTED.
Yet, existing tech could cut #CMM by MORE THAN HALF.
https://t.co/F5BURGSfwH
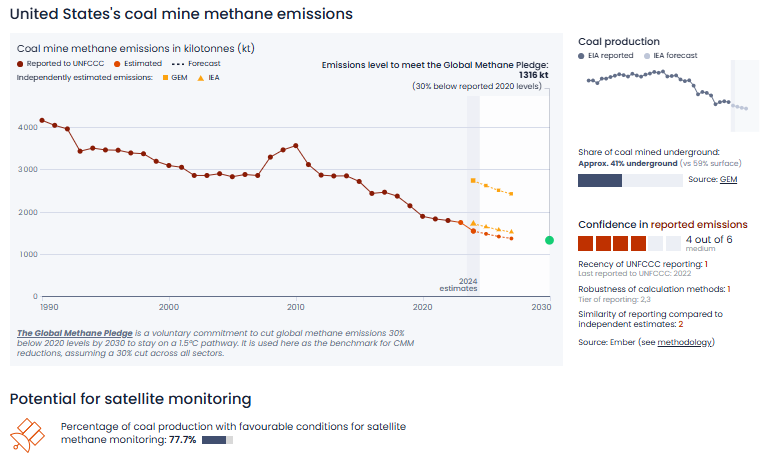
Steady reductions in U.S coal production means the U.S is reducing its coal mine methane emissions, and is on track with the 30% reduction target as proposed by the Global Methane Pledge.
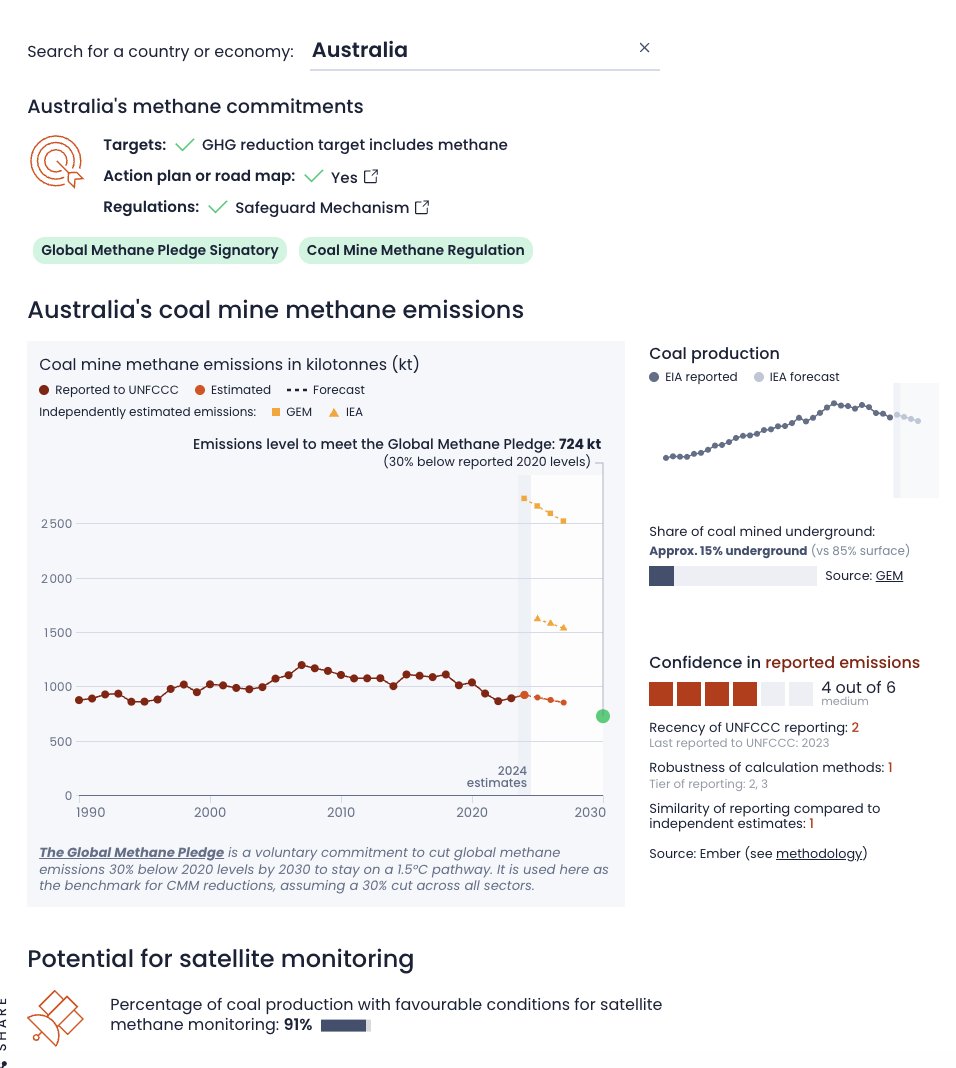
The data tracker lets you explore each country's officially reported data to the UNFCCC. Where official data is missing, gaps are filled using EIA production estimates combined with UNFCCC emissions intensity.
NEW DATA TOOL | Coal mines are a major source of methane. The big culprits could be vastly underreporting their CMM emission.
Ember’s new data tool allows you to explore where official data is lacking: https://t.co/oNQSZreEbz
At #EGU24? Come along to my poster at X5.93 between 10.45-12.30 to here me talk about global vertical profiles of tropospheric NO2 and O3 and how we can use these to improve the paramerisation of lightning in chemical transport models! ☁️⚡️👩🏻💻
We'll be talking about deriving NOx emissions for cities and hotspots in Asia (Eloise) and Africa (Nana) and vertical profiles of global tropospheric NO2 and ozone from TROPOMI (Bex @bexhorner ) ...
@EuroGeosciences@EGU_Atmos#EGU24
(1/3)
DEADLINE ALERT!
2nd GEOS-Chem Europe meeting (GCE2) for #atmoschem modelling scientists in London, 14-16 August 2023.
Registration deadline 12 June 2023.
Brief registration form here (https://t.co/O2XK57twpi).
DM me for any questions and pls retweet.
The 2nd GEOS-Chem Europe meeting (GCE2) will be held at @ucl on 14-16 August 2023.
Registration is now open! (link -https://t.co/O2XK57twpi)
Please share it with your networks of #atmoschem scientists.
DM me for any questions.
#GEOSChem#chemicaltransportmodelling#GCE2
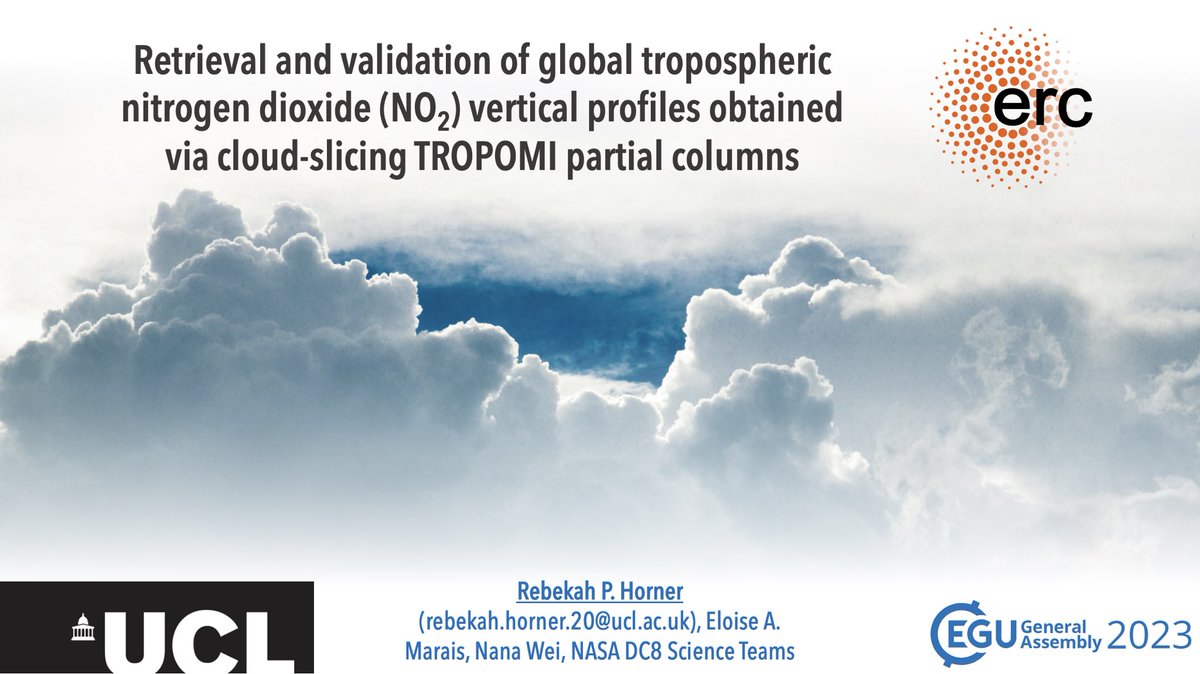
At #EGU23? Come along to room F2 at 17.30 CEST where I will be giving a talk on tropospheric vertical profiles of NO2 from TROPOMI and modelling results from GEOS-Chem 👩🏻💻🌩️🌍
In 1995 Paul Crutzen, Mario Molina and Sherwood Rowland were awarded the #NobelPrize in Chemistry for helping us understand why the ozone layer was disappearing.
#OTD in 1987, nations signed the Montreal Protocol to help us protect it.
GIF: NASA/NASA Ozone Watch/Katy Mersmann