Capitulation is a process, not an event.
Let’s study how the 2022 bear market unfolded.
First came the Stress Build-Up.
Then came months of Capitulation, where the Supply in Profit/Loss bands stretched and compressed, reflecting a market trapped under sustained pressure.
Next came the Stress Peak during FTX:
the final wave of panic, forced selling, and emotional exhaustion.
Only after stress stopped expanding did the Bottom Formation begin.
The lesson:
Bitcoin cycle bottoms are not formed when stress reaches its maximum.
They are formed when BTC changes hands through a prolonged process of stress among holders.
Capitulation is a process, not an event.
Look at February into early March:
→ Risk Index at 100
→ Selling pressure fully overwhelming structure
→ Bitcoin in free fall
→ Profit/Loss bands stretched and stressed for weeks
But the bottom did not form immediately.
First, Bitcoin started consolidating.
Then Risk began to ease.
Then the Profit/Loss bands started relaxing.
That is when the bottom formation process began.
The key point:
Capitulation is not simply reaching maximum stress.
It is how long Bitcoin remains trapped under stress and selling pressure.
The bottom begins when pressure stops expanding.
Impulse always reacts first, Momentum confirms later:
When BTC was still above $73K, Impulse had already started fading.
Then Momentum followed, crossed below -0.5, and stayed pinned at max negativity.
That is when the market entered capitulation mode:
→ price stalls
→ momentum freezes
→ traders get exhausted
The clue for when price can gain traction again is not price first. It is Impulse.
When Impulse starts transitioning back toward neutral, that is the first signal BTC may begin escaping stagnation.
The confirmation comes later:
→ Momentum starts moving again
→ Impulse holds neutral
→ Impulse turns positive
That is when BTC starts forming a base for a higher projection.
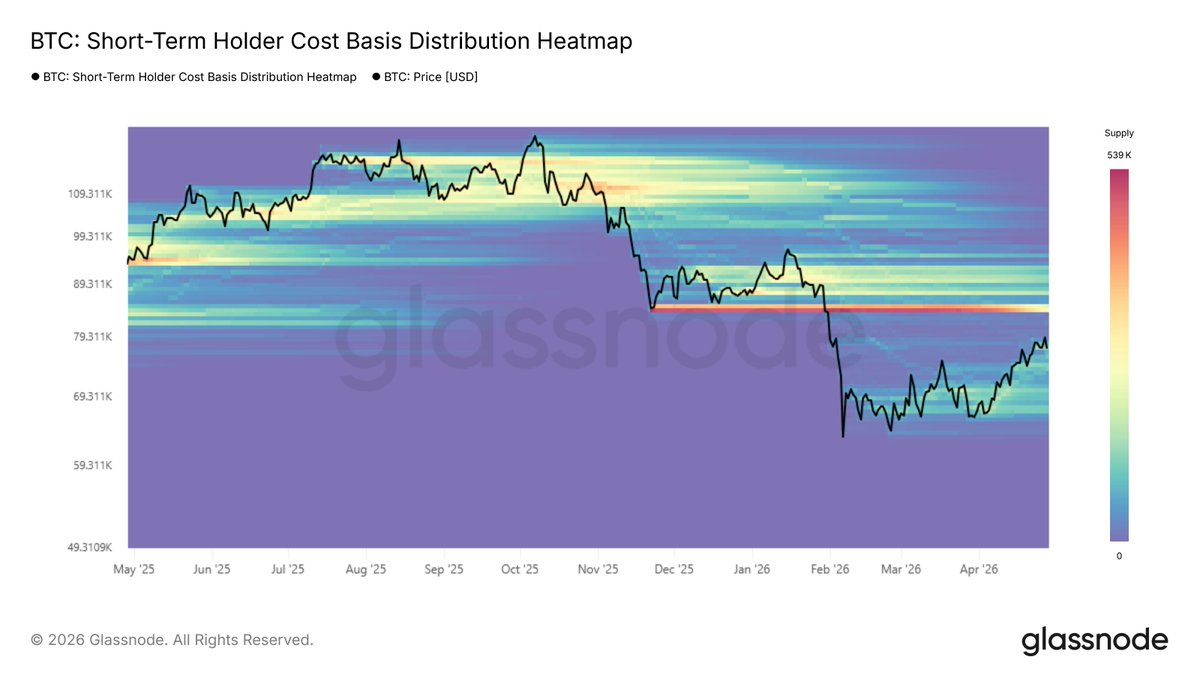
The Cost Basis Zone was the battlefield, and the Risk Index told us who was winning.
As Bitcoin lost the battle, it also lost:
→ The True Market Mean
→ The Short-Term Holder Cost Basis
→ The ETF Cost Basis cluster
Risk accelerated from Low Risk into full Capitulation Risk, handing control back to the sellers.
Price is now catching up to what the Risk Index had been warning all along.
Now the market needs to wait for the first sign of easing from the Risk Index.
That will be the first signal that selling pressure is starting to cool down.
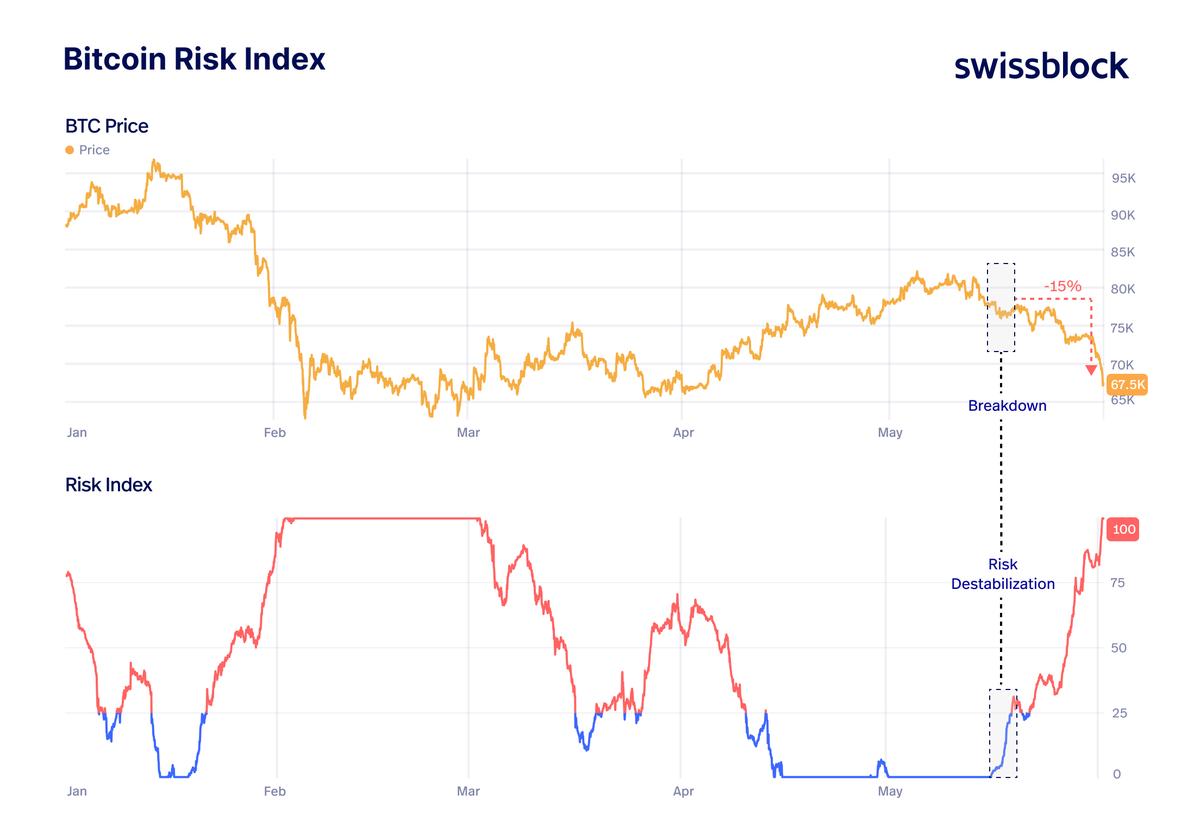
The Risk Index always has the first word.
First comes the warning. Then comes the breakdown.
Since Risk began destabilizing, Bitcoin has fallen almost 15% so far.
The loss of the Cost Basis Zone was decisive because it allowed sellers to start regaining control.
The key here is simple:
Risk Destabilization is the warning. Breakdown is the consequence.
By the time price confirms the breakdown, the Risk Index has often been warning weeks before.
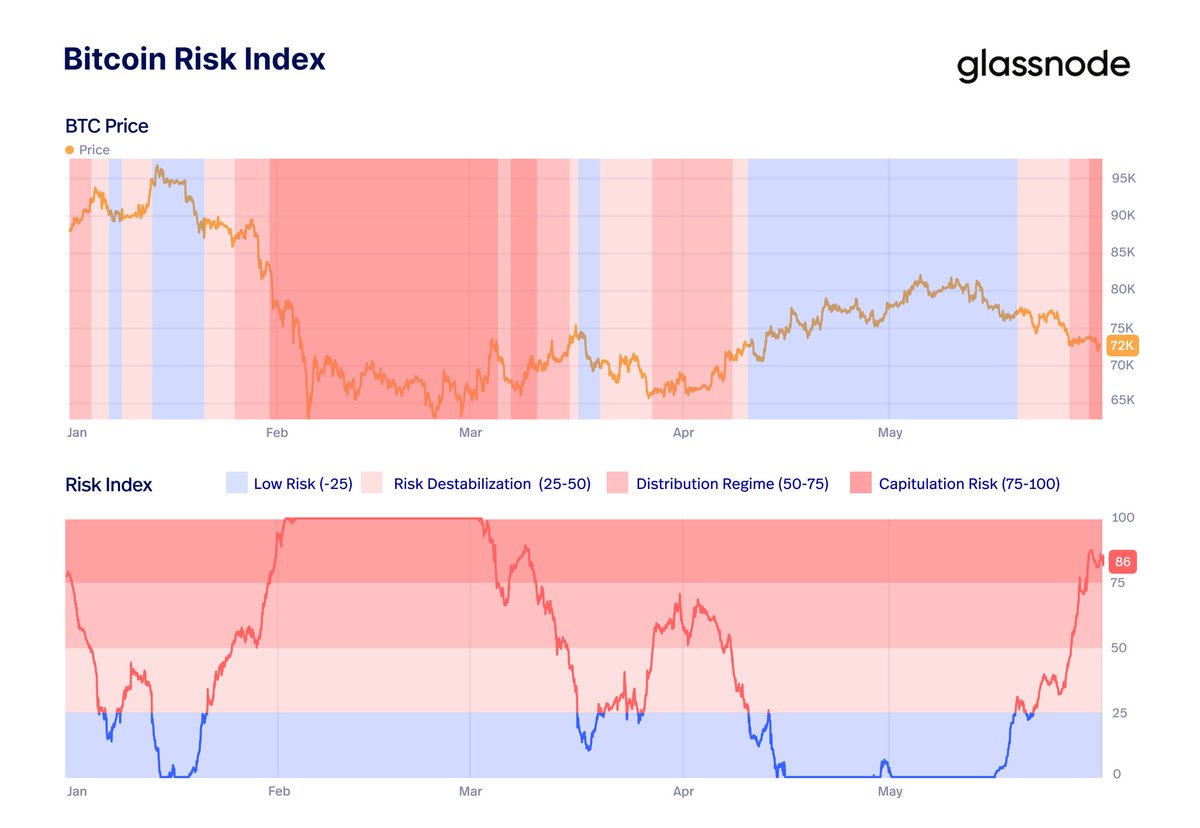
The Risk Index is not just bullish or bearish.
It measures how much selling pressure is damaging Bitcoin’s structure.
There are four regimes:
Low Risk: 0–25
Selling pressure is contained.
Demand is still absorbing.
Risk Destabilization: 25–50
The first cracks appear.
Structure is being tested.
Distribution Regime: 50–75
Selling pressure is no longer fully absorbed.
Sellers start gaining control.
Capitulation Risk: 75–100
Downside volatility expands.
Survival becomes more important than upside.
The key warning is when Risk shows its first cracks.
The key signal is not when momentum turns deeply negative.
It’s when momentum loses +0.5.
That is not the breakdown.
It is the first warning that expansion is fading and sellers may start regaining control.
In mid-2025, momentum cooled, but Spot CVD never showed aggressive distribution.
Bitcoin consolidated, the structure held.
But the last two times momentum lost +0.5, the setup changed:
→ Spot CVD weakened
→ Sellers regained control
→ Price structure deteriorated
That was the early warning before the October 2025 breakdown and the February 2026 capitulation.
Right now, momentum is still above +0.5.
But if it loses that level while Spot CVD keeps weakening, caution rises fast.
That would be the first signal that deterioration is starting beneath the surface.
Bitcoin momentum has faded from full max momentum.
But as long as it does not fall below -0.5, this does not imply breakdown.
What usually follows is consolidation.
The key reference is June–July 2025.
Momentum faded from full strength, but the indicator never broke below -0.5.
That allowed price to consolidate, rebuild, and eventually push toward new highs.
In the current setup, the same rule applies:
As long as momentum does not degrade significantly, the base case is consolidation, not breakdown (not yet).
One bearish scenario we have to consider:
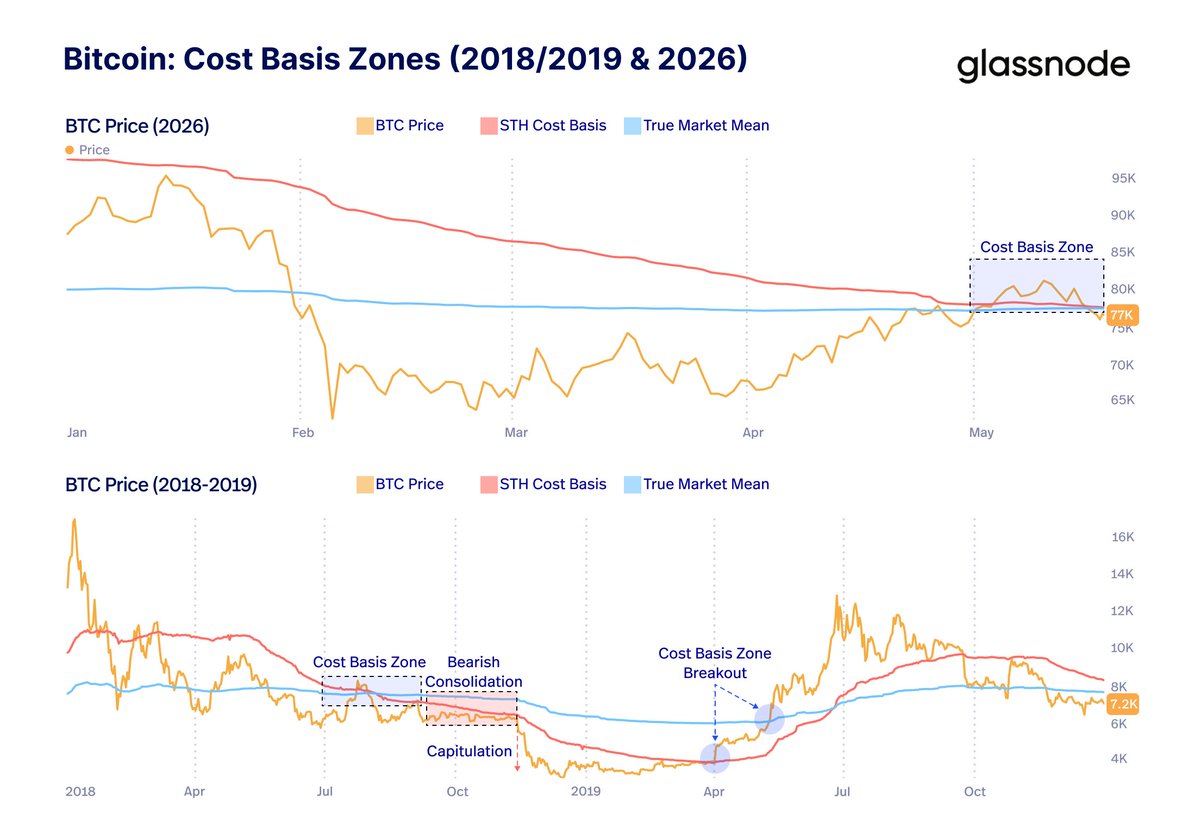
What if Bitcoin repeats the 2018–2019 cost-basis rejection structure?
Back then, BTC reclaimed the cost-basis zone and started consolidating above the True Market Mean and Short-Term Holder Cost Basis.
At first, it looked like the bear cycle was over.
But price failed to generate sustained expansion.
Then Bitcoin lost the zone, started consolidating below the cost-basis cluster, and eventually rolled into the final capitulation of the bear cycle.
Now, with BTC struggling below $78K, price is again below the cost-basis zone after losing it.
This is not confirmation of breakdown.
But structurally, it is one of the key bearish analogs bulls cannot ignore.
Bitcoin just lost the breakeven zone.
This is where the real battle begins:
Can holders who were back in profit tolerate being underwater again?
BTC is now below:
→ True Market Mean: $78.3K
→ Short-Term Holder Cost Basis: $78.6K
→ All ETFs Cost Basis: $83K
But the real signal is the Risk Index. Yes, it is still in low-risk territory.
But it has started to move higher. That reaction tells us selling pressure is beginning to inflict structural damage.
Risk moving out of maximum low risk is usually the first warning sign.
The first cracks before a breakdown.
Bookmark this:
One of the most important signals during bear-market transitions is not the breakdown itself.
It’s the Risk Index destabilization that comes before it.
In the 2022 bear market, Bitcoin briefly stabilized and Risk compressed into low-risk territory.
At first, it looked bullish.
But once Risk started losing stability and pushed back above the low-risk zone, the structure changed fast.
That destabilization preceded the April breakdown…
And later, a -35% collapse into the May capitulation.
This is why the current low-risk regime is so crucial.
As long as Risk remains suppressed, BTC can keep absorbing selling pressure and sustain expansion.
But when the Risk Index destabilizes again and re-enters high-risk territory, that becomes the first warning sign that sellers are regaining control.
Bookmark this in case of breakdown.
It rarely comes without a Risk Index warning first.
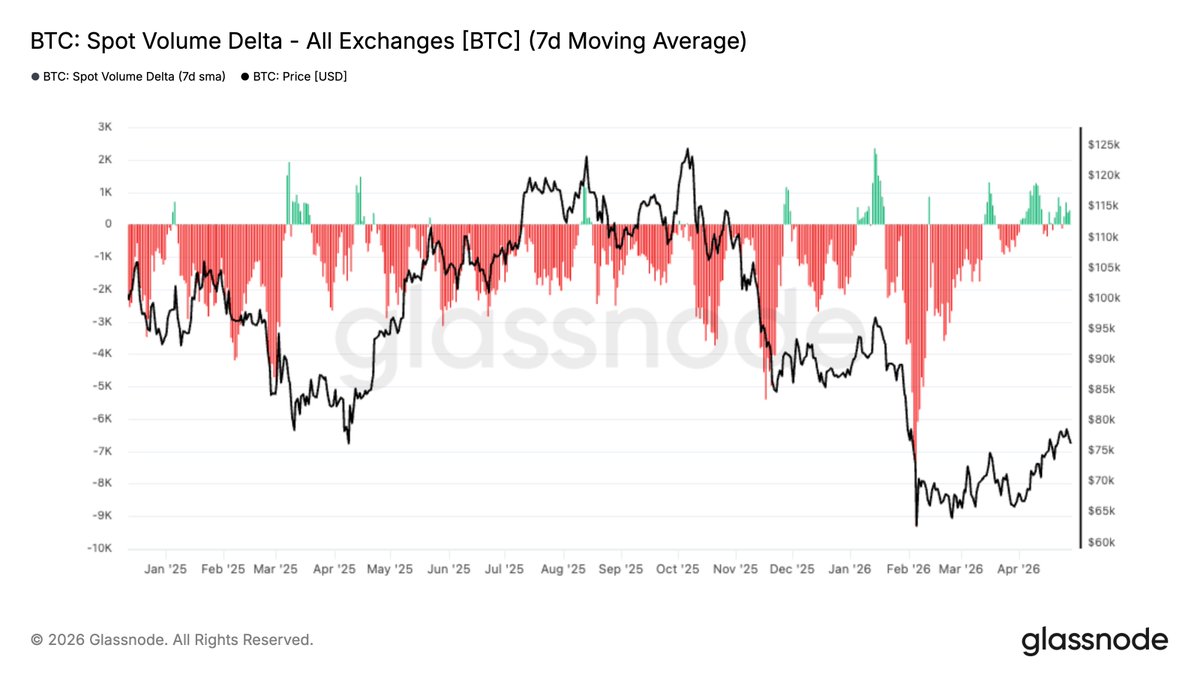
Bitcoin is not under selling-pressure stress.
So far, selling pressure has been absorbed.
But history gives us a warning:
When Supply in Profit and Supply in Loss begin to compress together, while the Risk Index moves out of low-risk territory, it precede a distribution phase.
After the Oct 10 crash, that pattern evolved into a sustained selling-pressure wave, culminating in February’s capitulation toward $60K.
Will we see another wave of selling pressure overwhelming Bitcoin?
The first warning signal would be clear:
Risk Index back to high risk.
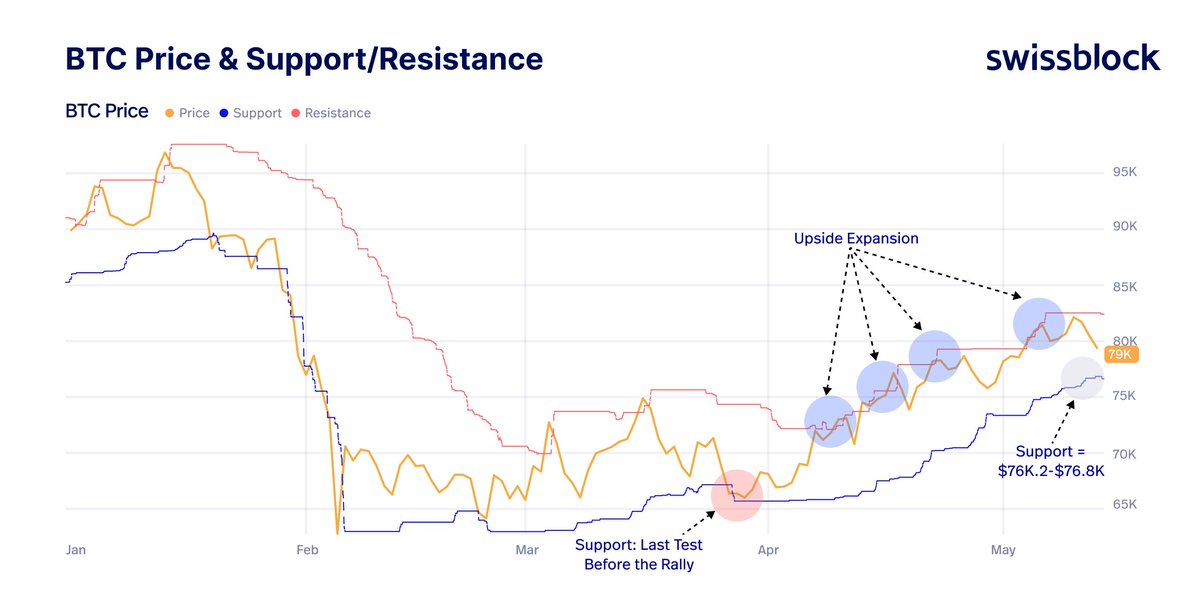
Bitcoin continues building a stair-step expansion structure.
Since the late-March lows, BTC has followed the same sequence repeatedly:
→ Resistance gets reclaimed
→ Price consolidates
→ Support steps higher
→ Expansion continues
Every breakout has been followed by a higher support formation.
As long as BTC does not break $76.2K–$76.8K, the bullish structure remains intact.
Hold that zone, and Bitcoin keeps room to expand the structure higher.
ETF holder conviction remains intact.
Despite the 2026 correction, BTC Spot ETFs have already recovered 76% of the drawdown from the October 2025 ATH balance.
• ATH Balance: 1.362M BTC
• 2026 Low: 1.258M BTC
• Latest: 1.337M BTC
Yes, ETF holders distributed from October to February.
But since then, they have resumed accumulation through weakness instead of fully distributing.
We are now entering the first stress test for ETF holders inside a bear-cycle environment.
So far, the response has been constructive:
→ ETF balances are rebuilding
→ Risk Index remains suppressed
→ BTC reclaimed the major cost-basis zones
But the key is what happens next.
If ETF balances keep rising while Risk stays low, Bitcoin can sustain expansion through $83K, and later toward $84K–$86K.
If ETF accumulation stalls while Risk accelerates higher, the structure becomes vulnerable again.
Flows remain the backbone of this recovery.
Bitcoin has entered the ETF battlefield.
Price is trying to consolidate inside the major ETF cost-basis zone:
• All ETFs Cost Basis: ~$83K
• BlackRock Cost Basis: ~$82.8K
• Grayscale Cost Basis: ~$80.1K
At the same time, the Risk Index remains anchored in low-risk territory, meaning selling pressure is still largely absorbed.
But unlike the Short-Term Holder Cost Basis, where we have clear evidence from past cycles, this is the first bear-cycle test for ETF holders.
This is where institutional conviction gets tested.
As price ranges below or inside the ETF cost-basis zone, we will see how ETF holders react around breakeven.
If overwhelming selling pressure emerges from ETFs, it should show up clearly in the Risk Index.
That is the signal to watch.
One of the clearest signals of Bitcoin’s early expansion:
ETF flows remain aligned with the Risk Index.
When the Risk Index stays in high-risk territory, selling pressure dominates
→ ETF flows tend to weaken or turn negative.
When the Risk Index resets into low-risk territory, selling pressure gets absorbed
→ ETF accumulation returns.
That synchronization is still in place.
Even when the Risk Index ticked slightly higher last week, ETF selling appeared briefly, but accumulation quickly resumed.
That tells us ETF demand is absorbing selling pressure.
This remains a flow-driven breakout.
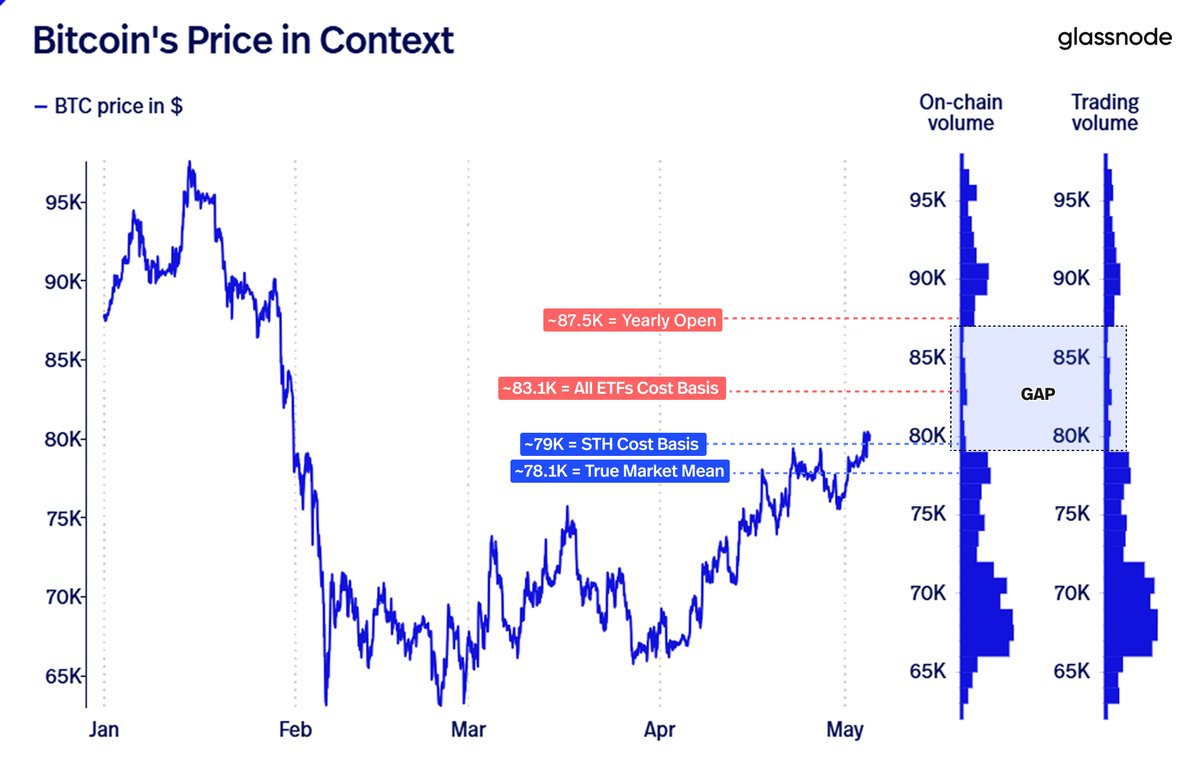
Bitcoin finally moved above $80K.
Now the key is consolidation.
BTC is capturing both:
• True Market Mean
• Short-Term Holder Cost Basis
So far.
These levels usually trigger selling pressure, but between $80K–$87K there is an air gap:
• Low on-chain volume
• Low trading volume
• Limited resistance
That means price can move efficiently through this zone.
But acceptance requires one thing:
Strong demand to absorb selling pressure.
Is Bitcoin heading into expansion?
So far, BTC’s upside expansion has been conservative.
Look at 2025:
When price truly expands higher, the volatility-adjusted resistance stretches upward.
At the same time, support rises and builds a base, either for continuation or stabilization.
Eventually, that support becomes the bulls’ first line of defense, currently around $74K.
If Bitcoin wants to win the Breakeven Battlefield, it needs to transition from stabilization to expansion.
And that should start looking more like May 2025.
Bitcoin is hitting the breakeven battlefield.
BTC is testing a stacked cost-basis zone between $78K–$83K:
• STH Cost Basis
• True Market Mean
• ETF Cost Basis
At the same time, the Risk Index remains in low-risk territory, meaning selling pressure has been largely absorbed, although it ticked higher yesterday.
→ Conditions are supportive
→ But selling pressure inside this cost-basis zone can be heavy
Break and hold = expansion
Reject = back to range
This is the decision zone.
Trapped Below Market Mean
bitcoin:native remains capped below the True Market Mean, with support at $65k–$70k. Spot selling is easing and flows stabilise, but demand is weak. Heavy short positioning leaves room for squeezes.
Read the full Week On-Chain👇
https://t.co/hmGyas9ob1
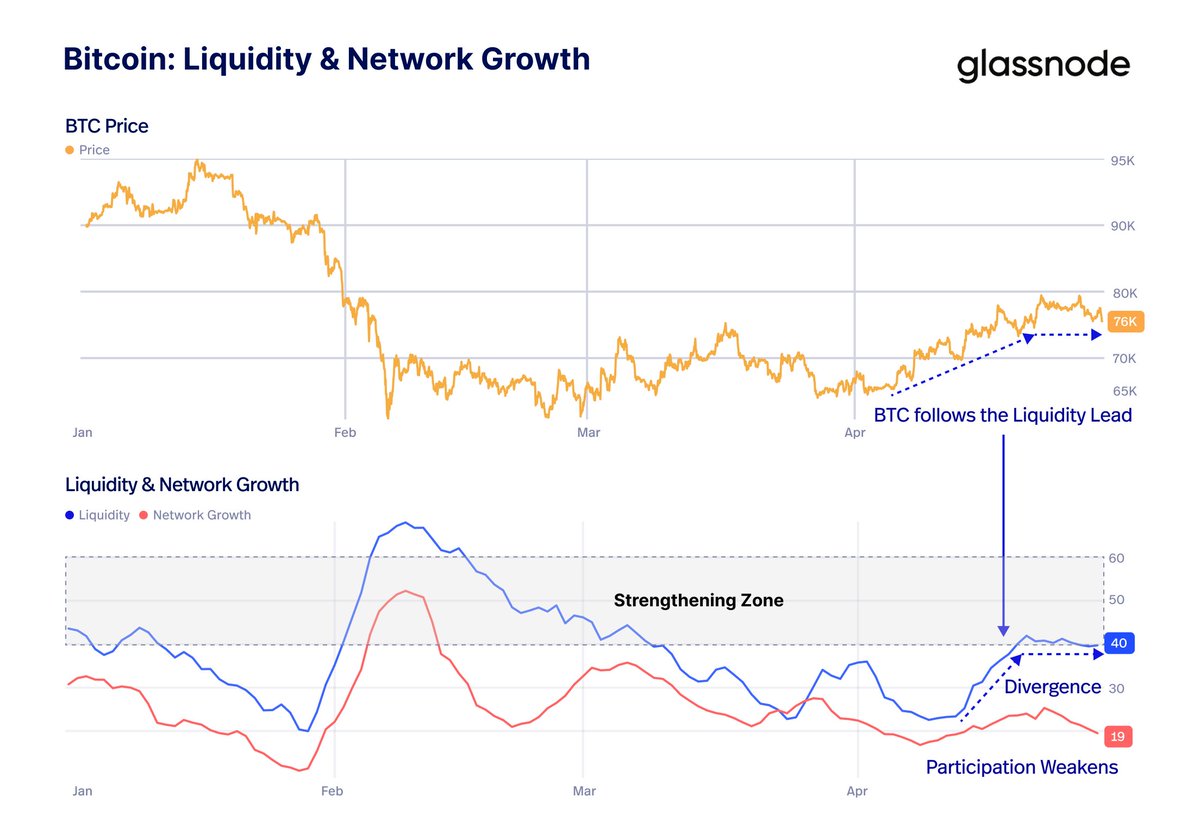
Liquidity has led Bitcoin’s price recovery.
But relying on only one fundamental component is like flying with one wing.
Network growth has stalled and continues to signal weakness.
That is a crucial divergence.
Liquidity can help Bitcoin take off, but without broader participation, it cannot sustain the flight.
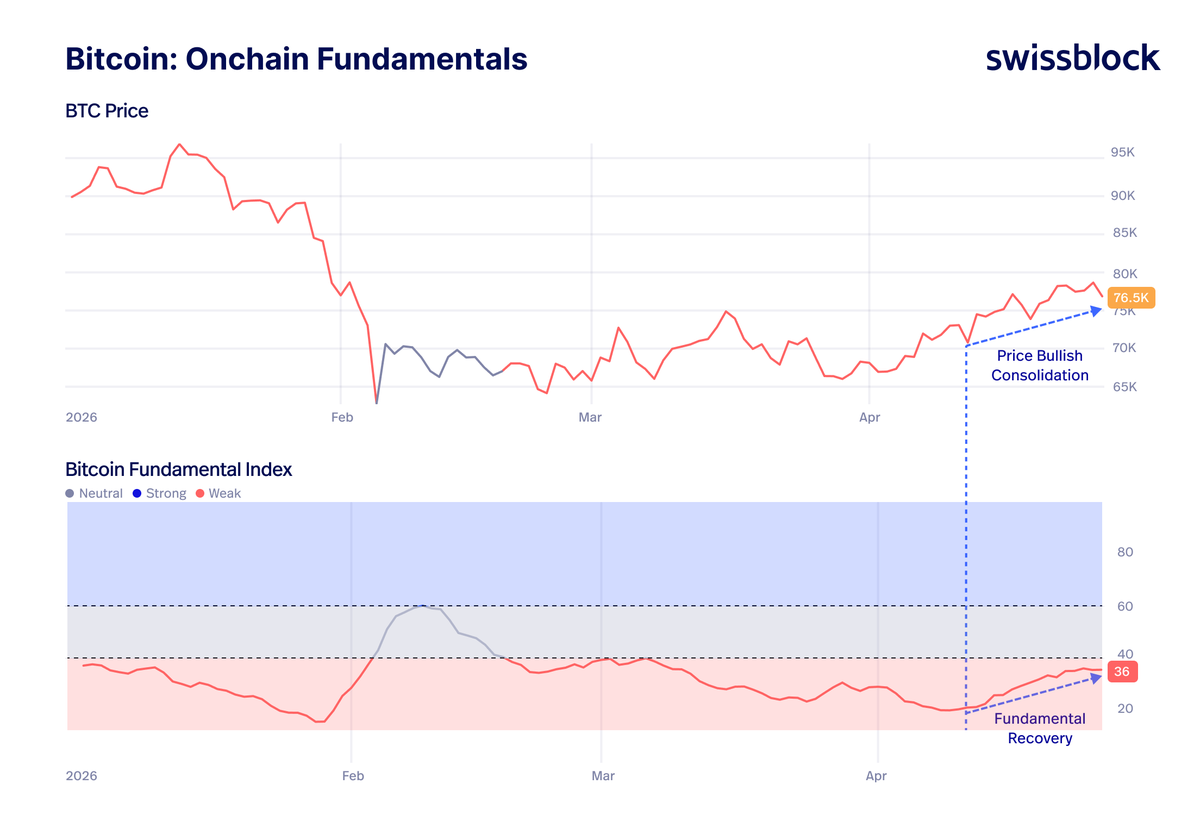
One silver lining for the bears:
Bitcoin’s price structure points higher,
but fundamentals remain weak.
They briefly improved toward neutral when BTC recovered from the $60K area, and have picked up again since BTC reclaimed $70K.
But not enough.
Price can still rise here.
But for a medium-term trend shift, Bitcoin needs neutral-to-strong fundamentals to confirm.
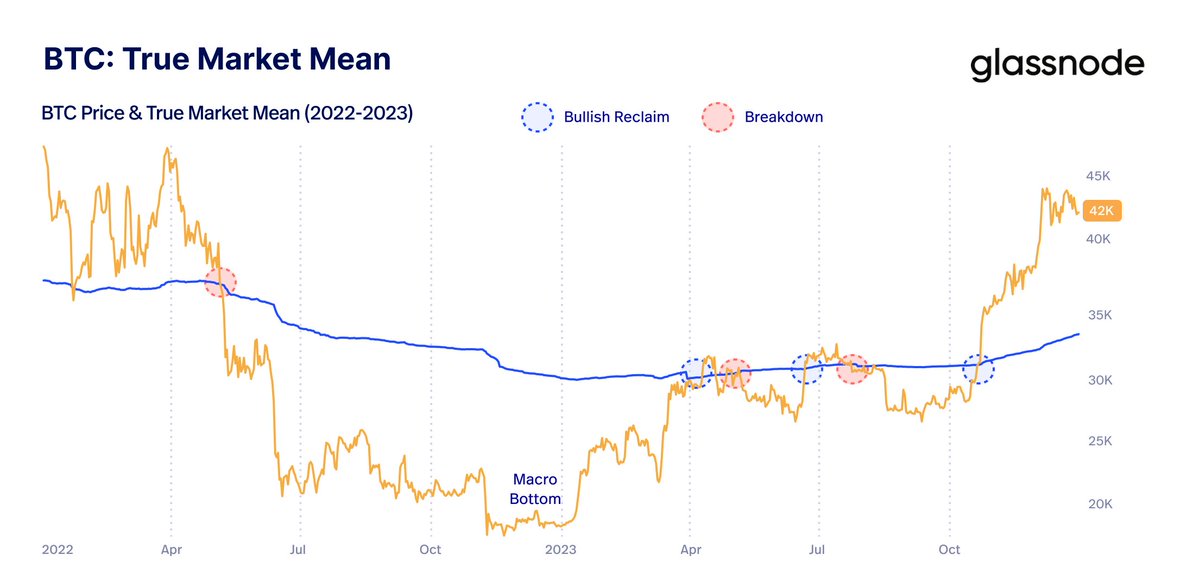
Bitcoin just hit the battleground:
It closed the week above the True Market Mean ($78K) for the first time since late January.
This level decides the regime.
In 2022, losing it led to prolonged weakness.
Reclaiming it in 2023 took months of consolidation.
→ Holding it changes the trend
→ Losing it brings back downside pressure
This week is key.