Dormant Bitcoin is waking up.
We built a live whale tracker that follows OG wallets and billion-dollar BTC moves before they hit the headlines.
View on https://t.co/xRXJbptmaI @lopp@DylanLeClair@WClemente@CryptoSlate@btcjvs
Public companies are all trying to speedrun the @Strategy playbook:
Buy Bitcoin
Raise capital
Buy more Bitcoin
So we built the API to track the whole game.
Newhedge Bitcoin Treasuries API is now live for 150+ companies. Holdings, acquisitions, mNAV, company data, and more.
https://t.co/4pjyWyUETG
If you want an inexpensive but exhaustive source of Bitcoin data I recommend https://t.co/8oqTkTojLR. It is great. They even have a nice power law chart and power law data you can download.
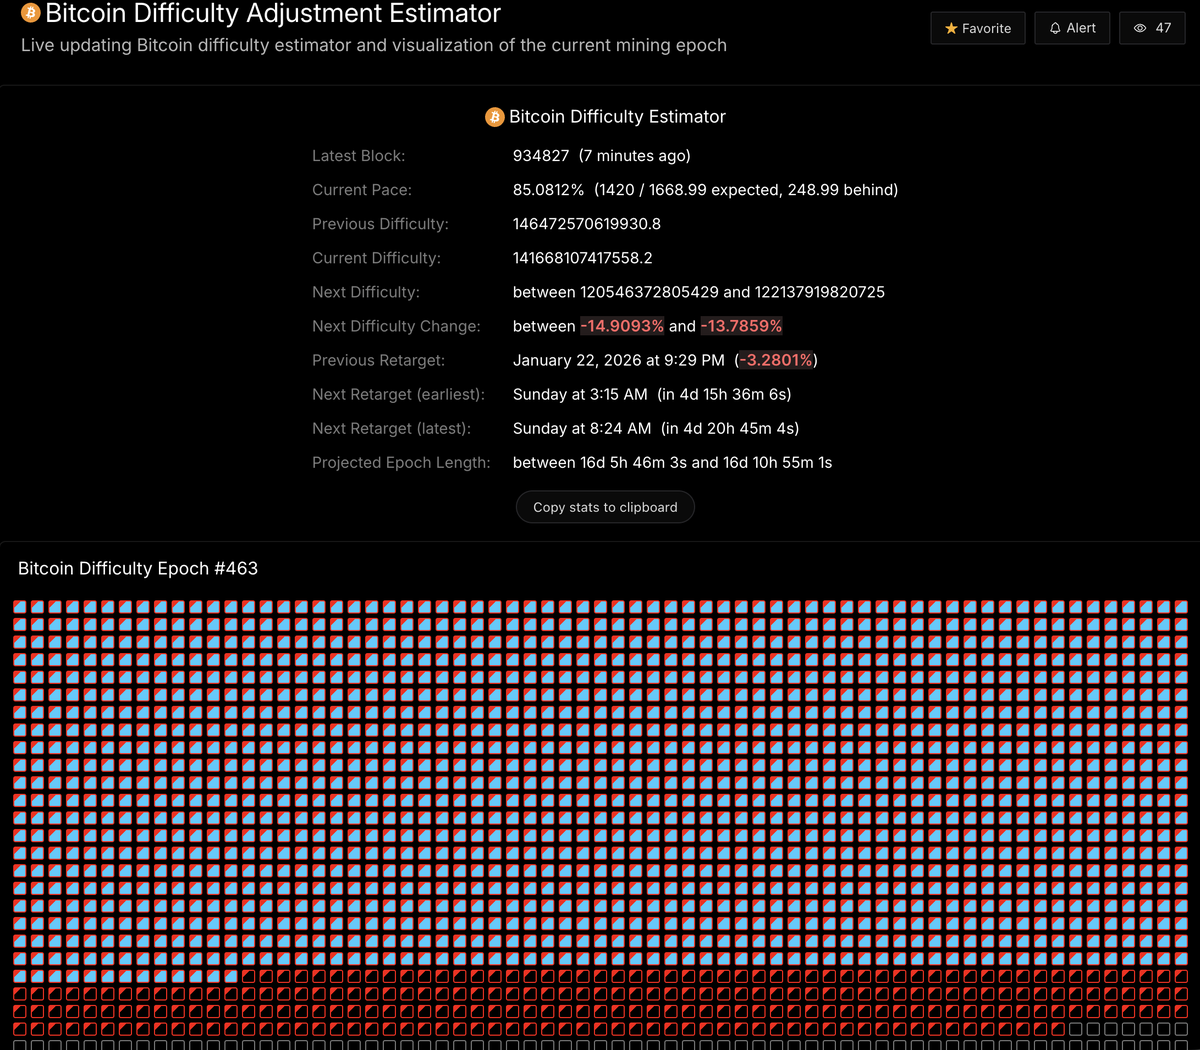
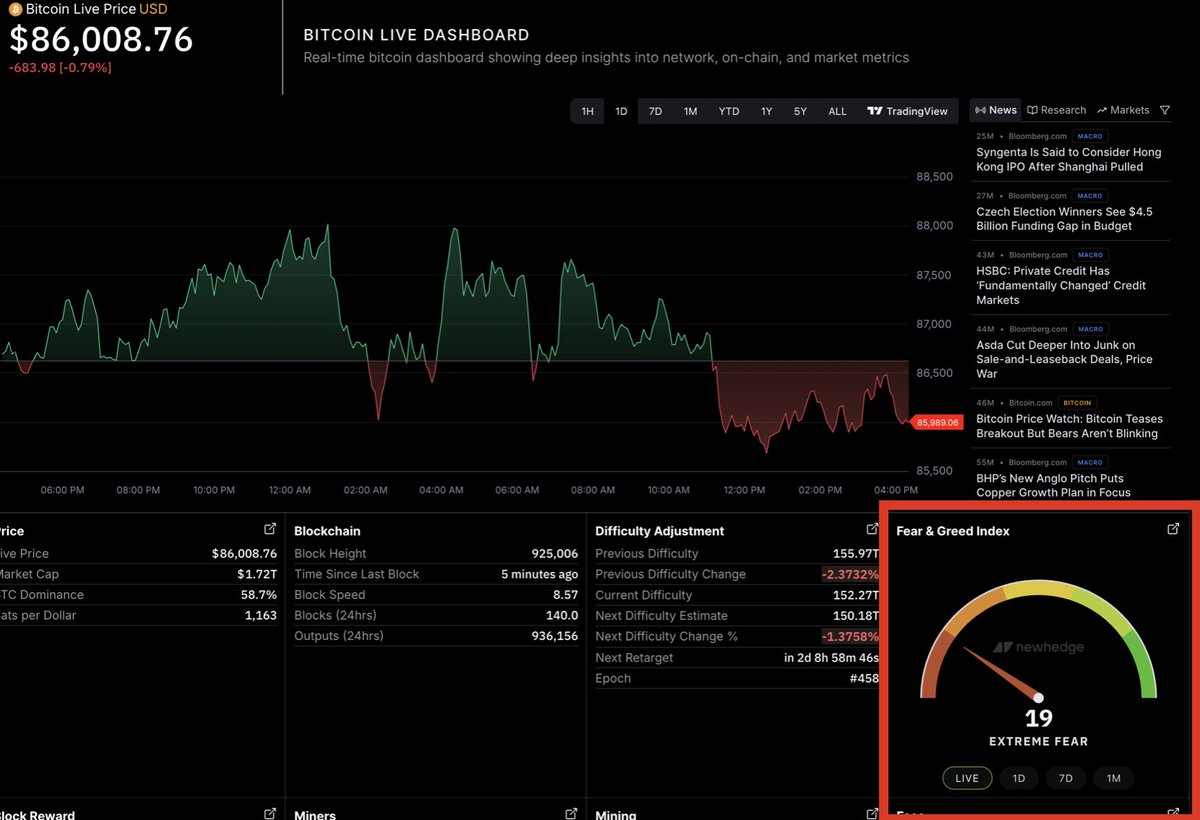
The Bitcoin Difficulty Estimator API is now live.
Track the next difficulty adjustment in real time as blocks are being mined. Updates every second.
https://t.co/HdpAB6fvPL
The Newhedge API is now live!
Access Bitcoin market, on-chain, and mining data through a single API, ready for your apps, dashboards, and trading systems.
Explore the API 👉 https://t.co/1rD3lUaLFY
Now live on Newhedge: Bitcoin HODL Waves.
Track the percentage of circulating supply that hasn’t moved across every age band, from 1 day to 1 year, 5 years, 7 years, and beyond.
Understand who’s holding. Understand who’s moving.
https://t.co/9DRPImzVQP
In about five days, Bitcoin is set to experience its largest downward difficulty adjustment since the China mining ban nearly five years ago
https://t.co/HdpAB6g3Fj
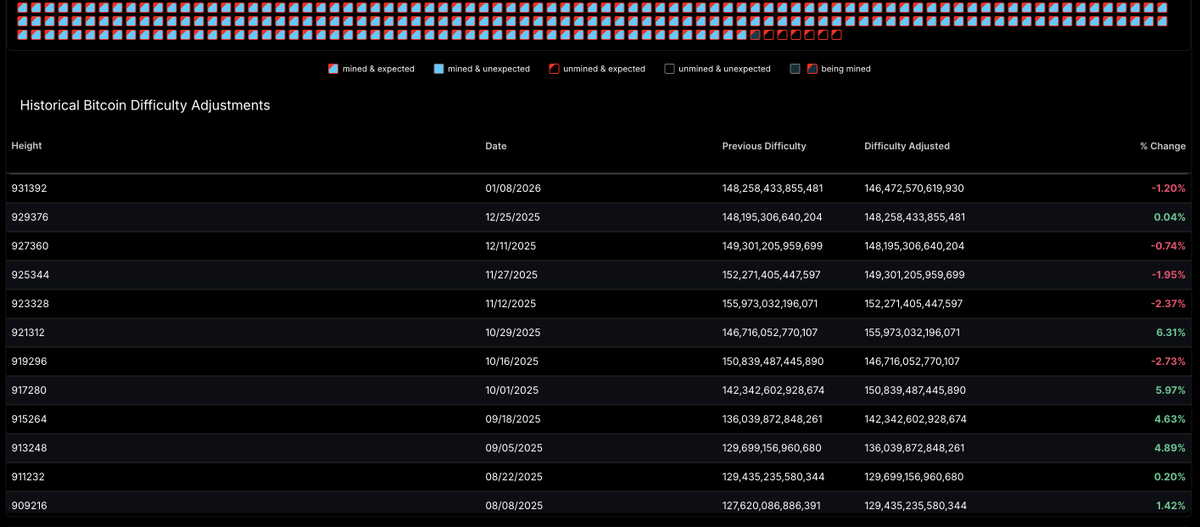
Historical difficulty adjustments can now be viewed on the Difficulty Estimator.
The entire difficulty change data from the start of Bitcoin’s history, complete with timestamps, block heights, values, and adjustment percentages.
https://t.co/HdpAB6fvPL
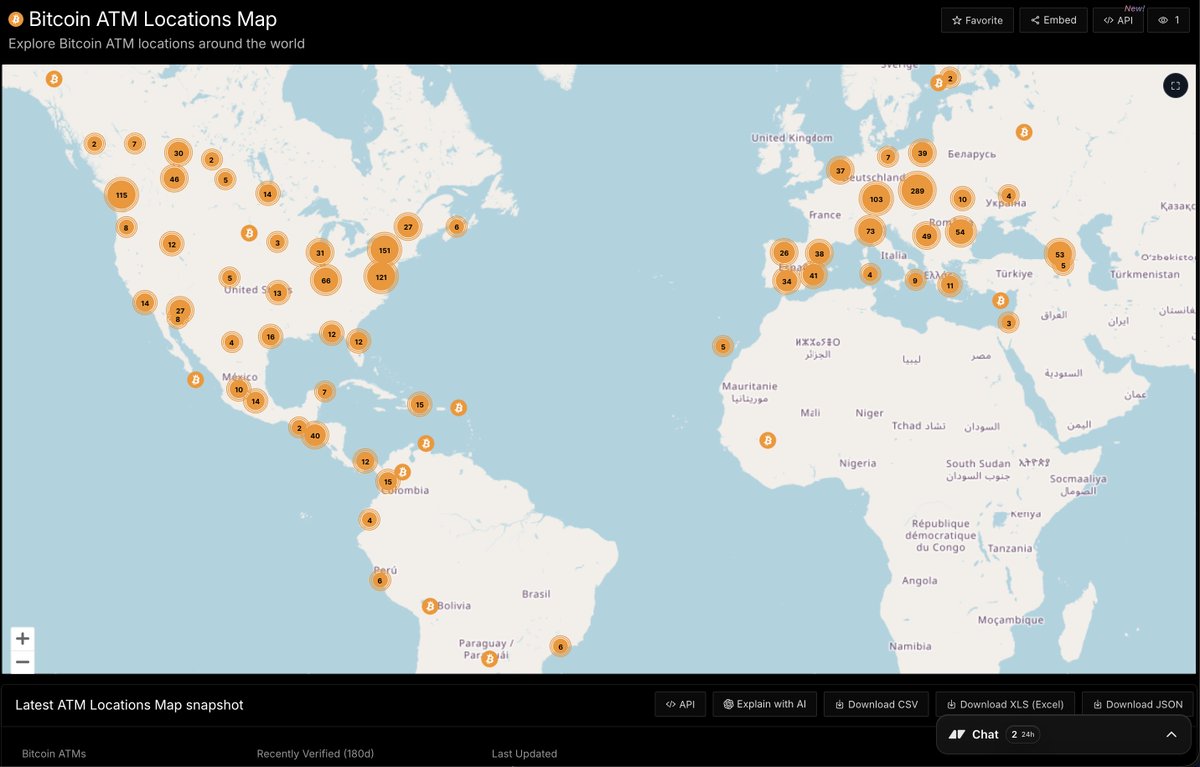
New on Newhedge!
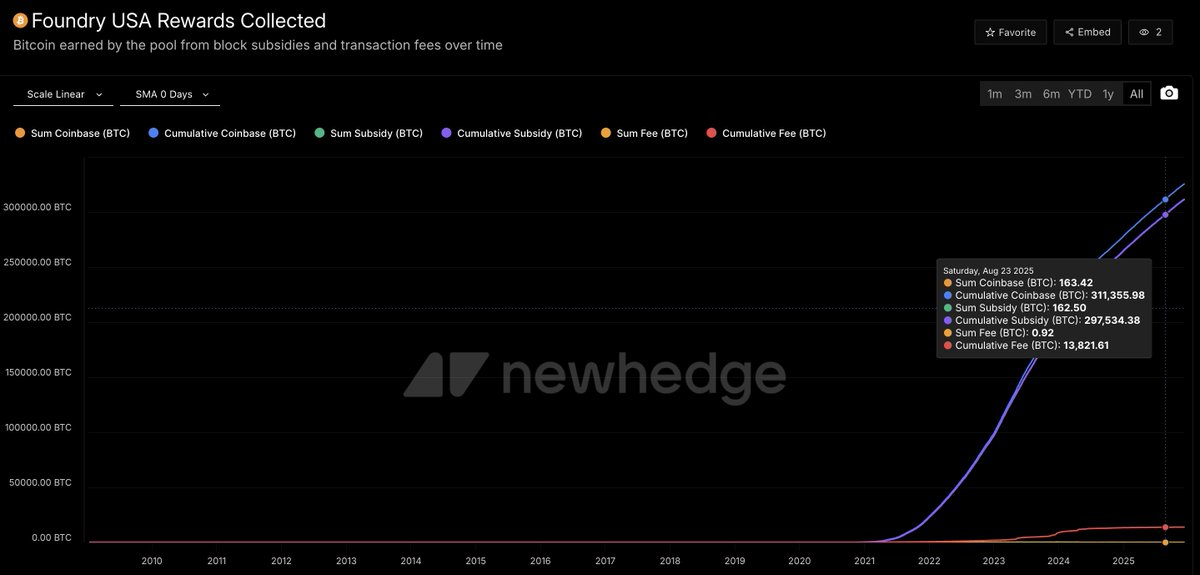
We've mapped the entire #bitcoin mining landscape: 150+ pools, their historic dominance, blocks mined, rankings, and reward flows.
See who really secures the network 👇
https://t.co/rSPsz5P8SN
Inflation adjustments used to be something you only needed for events that happened like 20,30,40 years ago ago and now we are already adjusting numbers from 2018 because purchasing power has dropped by about 22 percent since then
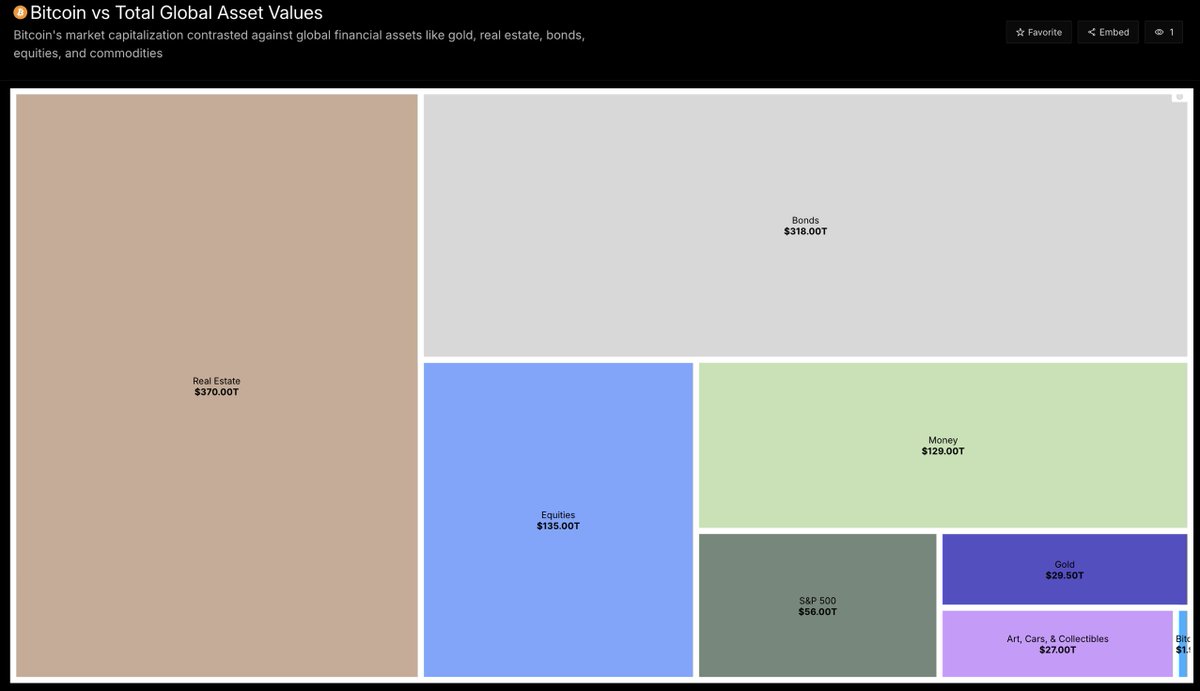
Big thanks to @Croesus_BTC for popularizing the Global Asset Value chart. An extremely powerful view of where Bitcoin stands in the global financial landscape.
We’ve built a live, interactive version 👇
https://t.co/e3dhg4uadD
Some interesting data regarding BTC holdings on-chain.
>More and more 100-1k BTC range institutions (most likely) and individuals stacking compared to last year
>1-100 range people, way less than last year, meaning that your average people just aren't interested in stacking sats, at least not this late in the cycle, and with stonk alternatives existing.
>More newcoiners than ever before, everyone wants to own at least 0.01, who knows..when it's worth millions...
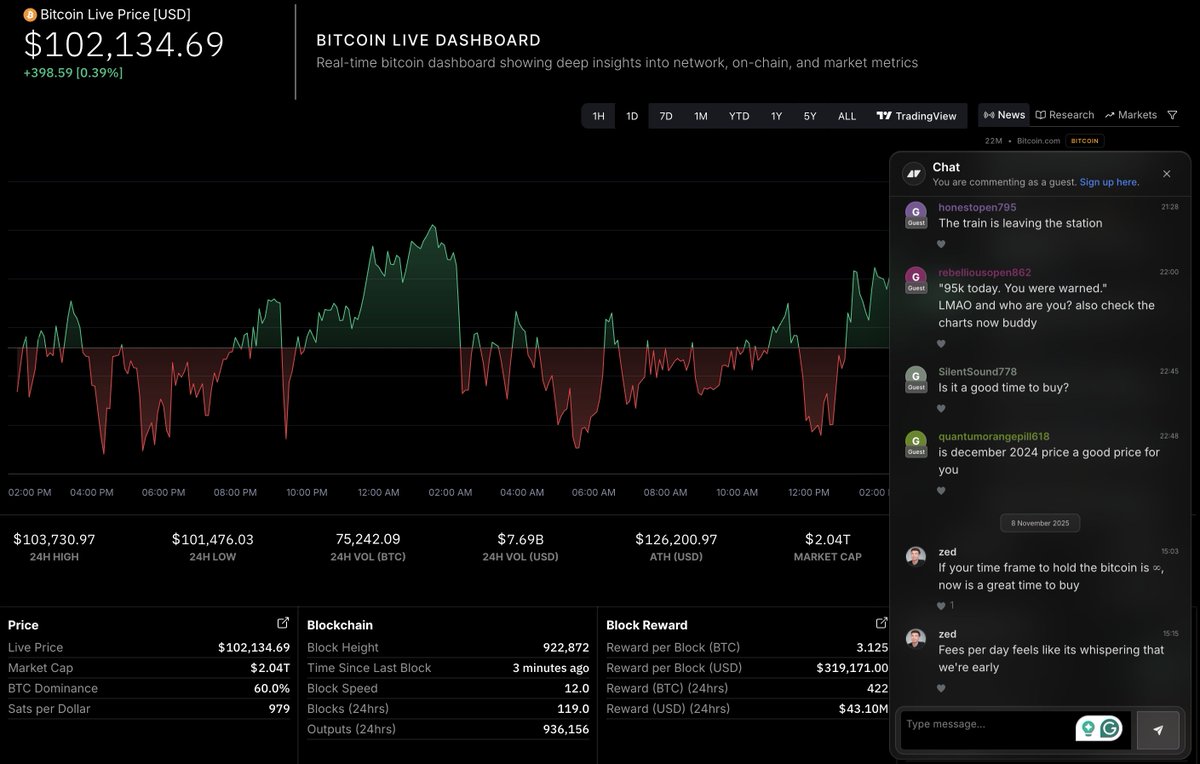
With usage rising we’ve expanded Newhedge Chat to be available across the entire platform.
Explore any chart and start a conversation instantly. Your #bitcoin analysis just got collaborative.
https://t.co/0nKTzt17V9