@HenrikZeberg Fed doesn’t print, it swaps. Bond out, reserve in. Same consolidated liability, different maturity. And reserves can’t leave the interbank system anyway.
Banks and deficits create money. 3.5T of QE gave 2% CPI. 5T of transfers gave 9%. Fiscal is the variable.
Is a bitcoin:native breakout on the verge of happening?
Momentum is rebuilding, but confirmation has not arrived yet.
Bitcoin has exited its Capitulation regime and is once again inside the Transition Area.
This is where a new impulse begins or momentum fades back into weakness.
The next test is clear:
→ Reclaim the Ignition Line
→ Build enough strength to push above the next Inflection Point
Every sustained rally began with this sequence, but not every transition has succeeded.
Only in April did BTC successfully anchor the market.
Failed stabilization attempts pushed the market further off course.
Now ETH remains at the wheel.
But that alone cannot secure stability.
For the market to stabilize structurally, leadership must re-anchor to BTC.
Just as bull rallies don't last forever, bear markets are not one continuous decline.
They are a sequence of regimes.
Each phase reveals something different about market structure.
Breakdown shows where sellers take control.
Consolidation shows where pressure starts slowing.
Recovery shows whether structure can rebuild.
Bearish Transition shows when that recovery fails.
The April-May rally repaired Bitcoin’s structure, but not enough to sustain a new trend.
Sellers regained control, and bitcoin:native rolled back into Breakdown.
But the next chapter is not necessarily another leg lower. We are starting to detect the first signs of transition:
the phase where downside pressure begins to exhaust, structure stabilizes, and the market moves toward consolidation.
That is how a bullish transition starts. Not with euphoria. With sellers finally losing force.
Not every summer registers declining on-chain activity.
Seasonality alone is not the signal.
The question is whether Bitcoin enters the summer with Liquidity deteriorating or recovering.
A bear or bull market environment is the decisive factor.
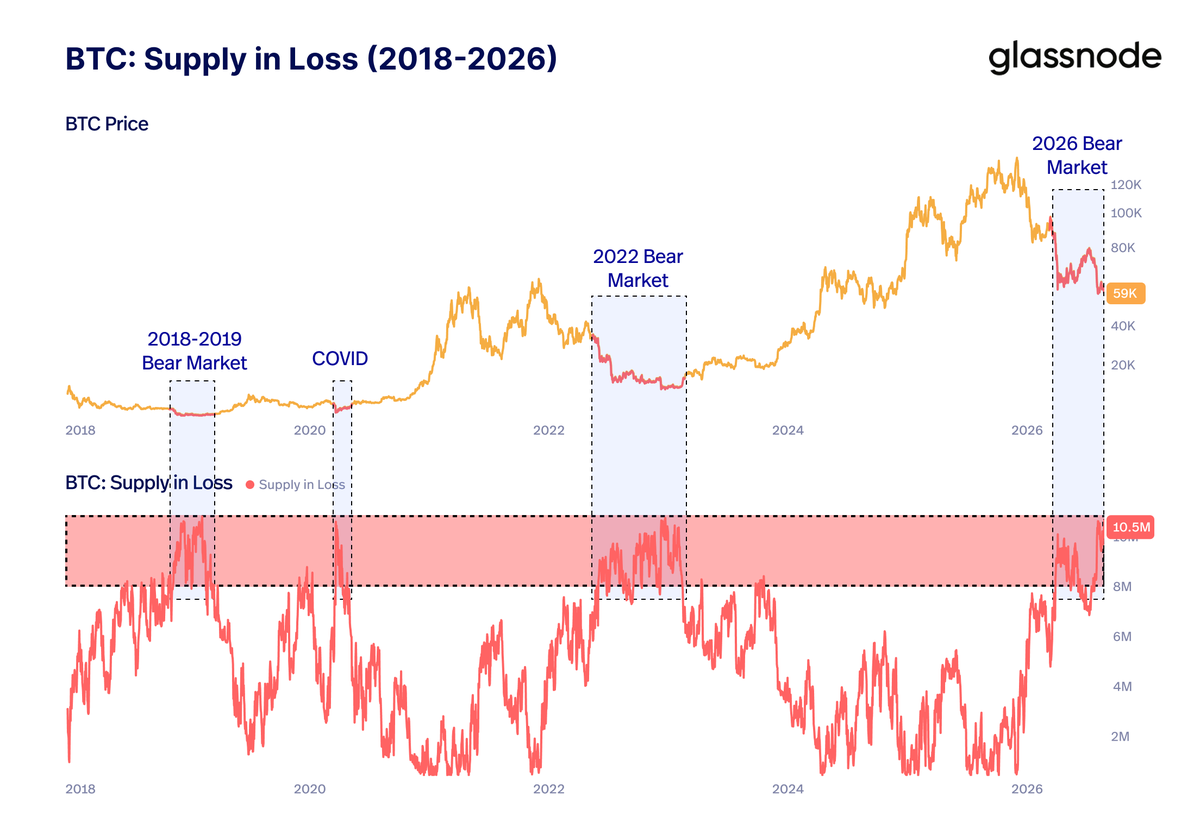
bitcoin:native holders are now in the same stress zone that defined prior bear-market bottoms.
Cycle bottoms are built when stress persists long enough to exhaust the holders sitting on losses.
That is when supply changes hands.
This is the most intense stress phase bitcoin:native has seen so far during this bear market.
Even more intense than February’s capitulation.
Look at the tension between holders in profit and holders in loss.
Supply in Loss has now overtaken Supply in Profit again, with more than 50% of holders underwater.
That is sustained holder stress. And in bear markets, this is exactly the type of environment where bottoms are built.
The key now is duration:
How long can Bitcoin remain under this level of stress before sellers run out of pressure?
Good first step in $btc and $eth price action, but we are not out of the woods just yet. OBV and momentum have not flipped positive yet with recent price moves. Risk of another retest of lows is still there.
Now that Bitcoin is deep in capitulation, what comes next?
Price Momentum is sitting at an extreme negative reading.
The first signal of structural reconstruction is simple:
Momentum needs to cross back above -0.5.
That is the moment when price starts building a new foundation.
It tells us capitulation is beginning to ease and trend expansion is possible again.
Until that happens, the base case remains fragile:
→ price builds a range
→ or price continues grinding lower
Capitulation is a process, not an event.
Let’s study how the 2022 bear market unfolded.
First came the Stress Build-Up.
Then came months of Capitulation, where the Supply in Profit/Loss bands stretched and compressed, reflecting a market trapped under sustained pressure.
Next came the Stress Peak during FTX:
the final wave of panic, forced selling, and emotional exhaustion.
Only after stress stopped expanding did the Bottom Formation begin.
The lesson:
Bitcoin cycle bottoms are not formed when stress reaches its maximum.
They are formed when BTC changes hands through a prolonged process of stress among holders.
Unusual strength has emerged across altcoins.
While Bitcoin has retraced the entire recovery from the February lows, Alts vs BTC are breaking out with force, marking a new phase of altcoin leadership.
But the key question is:
Is this altcoin strength, or simply Bitcoin weakness?
Bitcoin dominance spent months trapped in a consolidation range. May briefly produced a Bitcoin-led regime, but that leadership has now broken down.
Once BTC lost leadership, Market Phase rotated toward Large Caps as alts began strengthening.
That means this is altcoin strength derived from BTC weakness. Not a confirmed structural rotation.
And that is the risk. This kind of altcoin strength can become a trap.
If alts have resisted better than BTC, the market may still come for them next once Bitcoin weakness spreads.
🇺🇸 TRUMP JUST POSTED THIS!!
“A peace agreement with Iran has been largely negotiated and will be announced shortly.”
“The Strait of Hormuz will be opened.”
ETH has lost ground against Bitcoin.
Not even the recent altcoin volatility phase has helped. Actually, the opposite happened:
ETH/BTC has continued weakening and is breaking down its monthly support.
ETH still showed relative strength into early April, but once BTC anchored the market again, ETH started losing leadership.
Now ETH price has formed a short-term downtrend with lower highs.
If ETH fails to hold this six-week low, the next risk is clear:
sub-$2,000 comes back into view.
The key signal is not when momentum turns deeply negative.
It’s when momentum loses +0.5.
That is not the breakdown.
It is the first warning that expansion is fading and sellers may start regaining control.
In mid-2025, momentum cooled, but Spot CVD never showed aggressive distribution.
Bitcoin consolidated, the structure held.
But the last two times momentum lost +0.5, the setup changed:
→ Spot CVD weakened
→ Sellers regained control
→ Price structure deteriorated
That was the early warning before the October 2025 breakdown and the February 2026 capitulation.
Right now, momentum is still above +0.5.
But if it loses that level while Spot CVD keeps weakening, caution rises fast.
That would be the first signal that deterioration is starting beneath the surface.
And now the warning is flashing.
The Risk Index has re-entered high-risk territory.
That doesn’t confirm breakdown yet.
But it confirms that selling pressure is no longer being fully absorbed.
This is exactly why the low-risk regime was so crucial:
As long as Risk stayed suppressed, BTC could absorb pressure and sustain expansion.
Now the structure may be changing:
→ Risk has destabilized
→ BTC lost the $78K–$79K breakeven zone
→ Sellers are starting to regain control
The key now is whether Risk accelerates higher from here, or BTC starts absorbing selling pressure again.
If Risk reanchors back below 25, BTC can still stabilize.
If high risk expands, this becomes the first solid confirmation that the breakdown warning was the first shot.
Bitcoin just lost the breakeven zone.
This is where the real battle begins:
Can holders who were back in profit tolerate being underwater again?
BTC is now below:
→ True Market Mean: $78.3K
→ Short-Term Holder Cost Basis: $78.6K
→ All ETFs Cost Basis: $83K
But the real signal is the Risk Index. Yes, it is still in low-risk territory.
But it has started to move higher. That reaction tells us selling pressure is beginning to inflict structural damage.
Risk moving out of maximum low risk is usually the first warning sign.
The first cracks before a breakdown.
This is how momentum exhaustion looks like:
→ Momentum fails to sustain expansion
→ Reignition attempts fade quickly
→ Positive momentum loses force with every bounce
→ Impulse collapses back into deep negative territory
This is not aggressive downside pressure yet.
It is something more subtle:
Bitcoin is losing its capacity to regenerate strong positive momentum internally.
Each rebound becomes weaker. Each ignition attempt carries less force.
Momentum exhaustion is not the breakdown itself.
It is the process that usually comes before it.
Bitcoin has consolidated inside the breakeven battlefield.
But now it is walking through a minefield.
BTC has taken control of the line that separates bear market continuation from a renewed bullish trend.
But one battle won is not conquest.
Bitcoin is still in the middle of a transition.
The Market Trend model has clearly mapped this shift:
→ Bottom
→ Recovery
→ Consolidation
Now BTC is moving between Recovery and Breakdown signals.
That usually happens after an expansion phase, when Bitcoin pauses, absorbs pressure, and prepares for the next attack.
The key now:
Hold this zone to launch another push toward $83K.
Otherwise, this consolidation turns into exhaustion.
Bitcoin is not under selling-pressure stress.
So far, selling pressure has been absorbed.
But history gives us a warning:
When Supply in Profit and Supply in Loss begin to compress together, while the Risk Index moves out of low-risk territory, it precede a distribution phase.
After the Oct 10 crash, that pattern evolved into a sustained selling-pressure wave, culminating in February’s capitulation toward $60K.
Will we see another wave of selling pressure overwhelming Bitcoin?
The first warning signal would be clear:
Risk Index back to high risk.
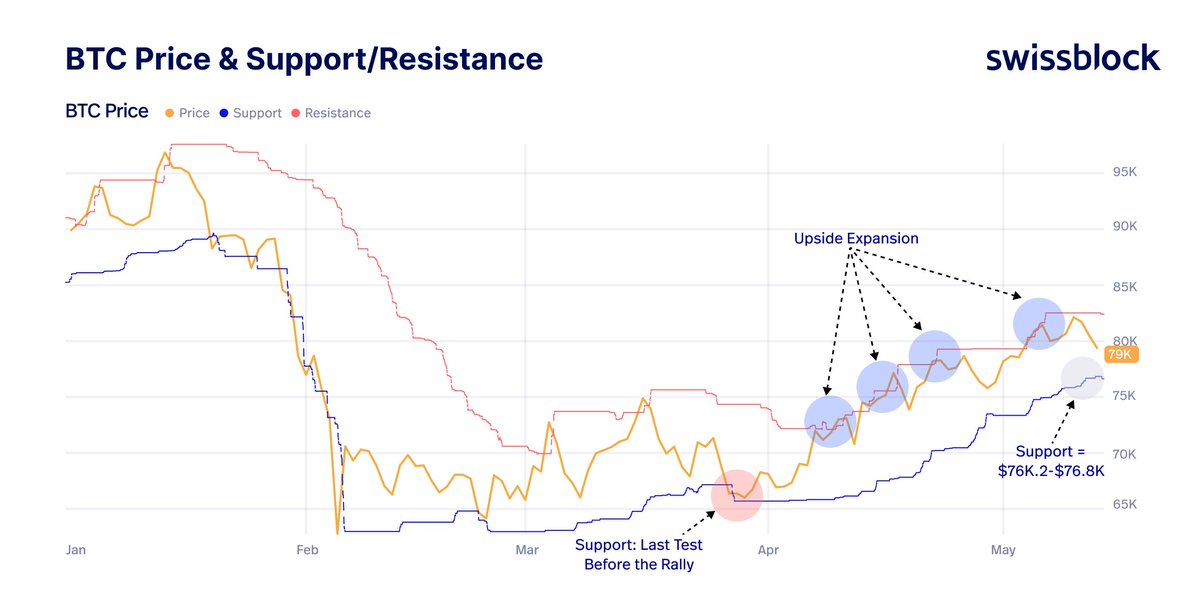
Bitcoin continues building a stair-step expansion structure.
Since the late-March lows, BTC has followed the same sequence repeatedly:
→ Resistance gets reclaimed
→ Price consolidates
→ Support steps higher
→ Expansion continues
Every breakout has been followed by a higher support formation.
As long as BTC does not break $76.2K–$76.8K, the bullish structure remains intact.
Hold that zone, and Bitcoin keeps room to expand the structure higher.