This is the same but for 2025, including postseason… I agree with number one
And the relative weights of each component are shown.
I would like to include cwpa, pitch location but wanted to work basically only with play-by-play data from savant
This is a very very cool home run. Probably the max possible wpa!!
According to my made up statistic “aura+”, it’s the 6th coolest home run of the year!
I would put it higher myself tho…
@Sean_Deere@BaseballWRLD_ Would you learn more about the batter if the ball bounced off the fielders head and over the fence?
Or if he hit a ball so well in coors and it went 50 ft over the fence?
Player analysis is ab looking at what the players can actually control
@Nyanasaur@Dapal5@Sean_Deere@BaseballWRLD_ They all are, to see it u can play around with savant search w diff ev la combos
Notice how on gbs faster players get more credit for same combo, while on air balls everyone gets the same credit
Below is 95 mph, -7 deg and 95 mph, 20 deg
https://t.co/fK63krasD1
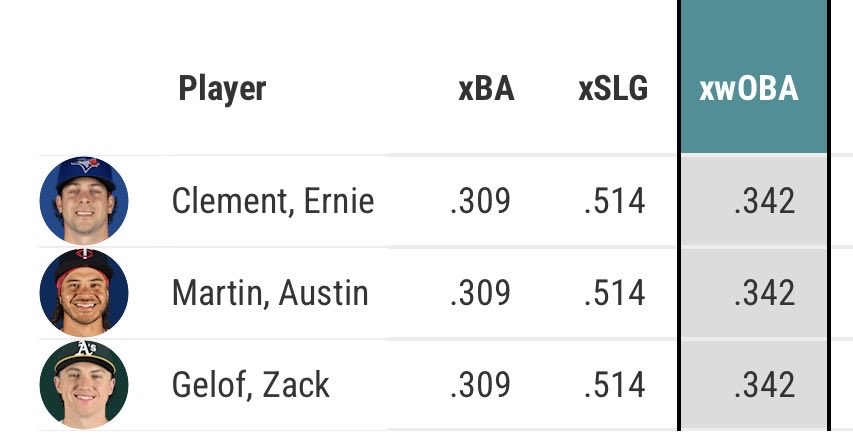
@Sean_Deere@BaseballWRLD_ Yea for figuring out how good a batter has been, xstats matter more
Sometimes a hitter smokes the ball in the air and gets nothing, other times they get a bloop hit by accident
xstats see thru that! Ex, on this play below: xslg=1.031, slg=0, hr in 29/30
https://t.co/5P4ibqTytx
@SeanFennessey Statcast watches all the games and as you can see in the graph, Bo has turned it around many times
Just wait until he turns it around for good. We are going to need a bigger graph 📈
@Sox_Savant A extreme example this yr tho is poor rowdy tellez, he’s only played on the road in petco and citi field (both 92 pf on fangraphs, loses him 8 pts of wrc+)
@Sox_Savant Well in general on the road the diff btwn no PF and smth like a PA wtd PF are going to be very small
Rockies players are disadvantaged by ~1 pt of wrc+ in general (and they’re an extreme case)
Goodman has visited more hitter friendly parks this yr so his pa wtd pf is 100
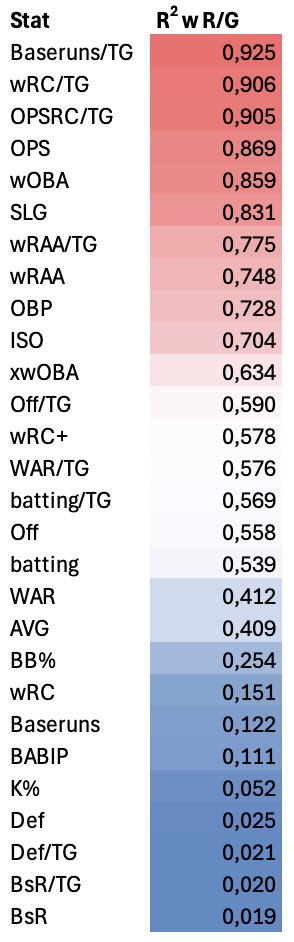
@EliotJurgensen@PitcherList It’s good but this chart makes it seem like it’s better than woba
The chart proves it isnt tho since wrc is based on woba (cant do same w ops bc its bad math)!
Since the charts question is about team r/g, ops and woba aren’t the right tool (baseruns/g better than wrc/g)
@EliotJurgensen@PitcherList It’s good but this chart makes it seem like it’s better than woba
The chart proves it isnt tho since wrc is based on woba (cant do same w ops bc its bad math)!
Since the charts question is about team r/g, ops and woba aren’t the right tool (baseruns/g better than wrc/g)
@ejmb0000000@BaseballWRLD_ In my modelling with his bat speed avg up 4mph his fast swing rate would be 89.1% (best in mlb)
It def helps to swing faster, but only on balls hit in the LA sweetspot
Ex. Yordan the elite la sweetspot guy, gains ~22 runs on his bip in same model (and is 12 runs better in k+bb)
@ejmb0000000@BaseballWRLD_ I fear that it isnt so much a bat speed problem with him
Modelling him as mlbs bat speed leader optimisticly adds ~14 runs of value to his season, which would make him a league avg hitter…
Bad launch angles + too many Ks are the culprit imo
@M_D_L_J@TheWARmonger_ Yes PCA has been getting less 5 star opps than other CF on a per fly ball + line drive against basis
But overall he is getting a pretty normal amount of opportunities, with a normal general difficulty level