BMLL CEO, Paul Humphrey, is recognised in the TabbFORUM 40 Innovators in Financial Markets for 2026. This marks the fifth consecutive year he is named among the industry’s leading innovators.
Thank you to TabbFORUM for the recognition!
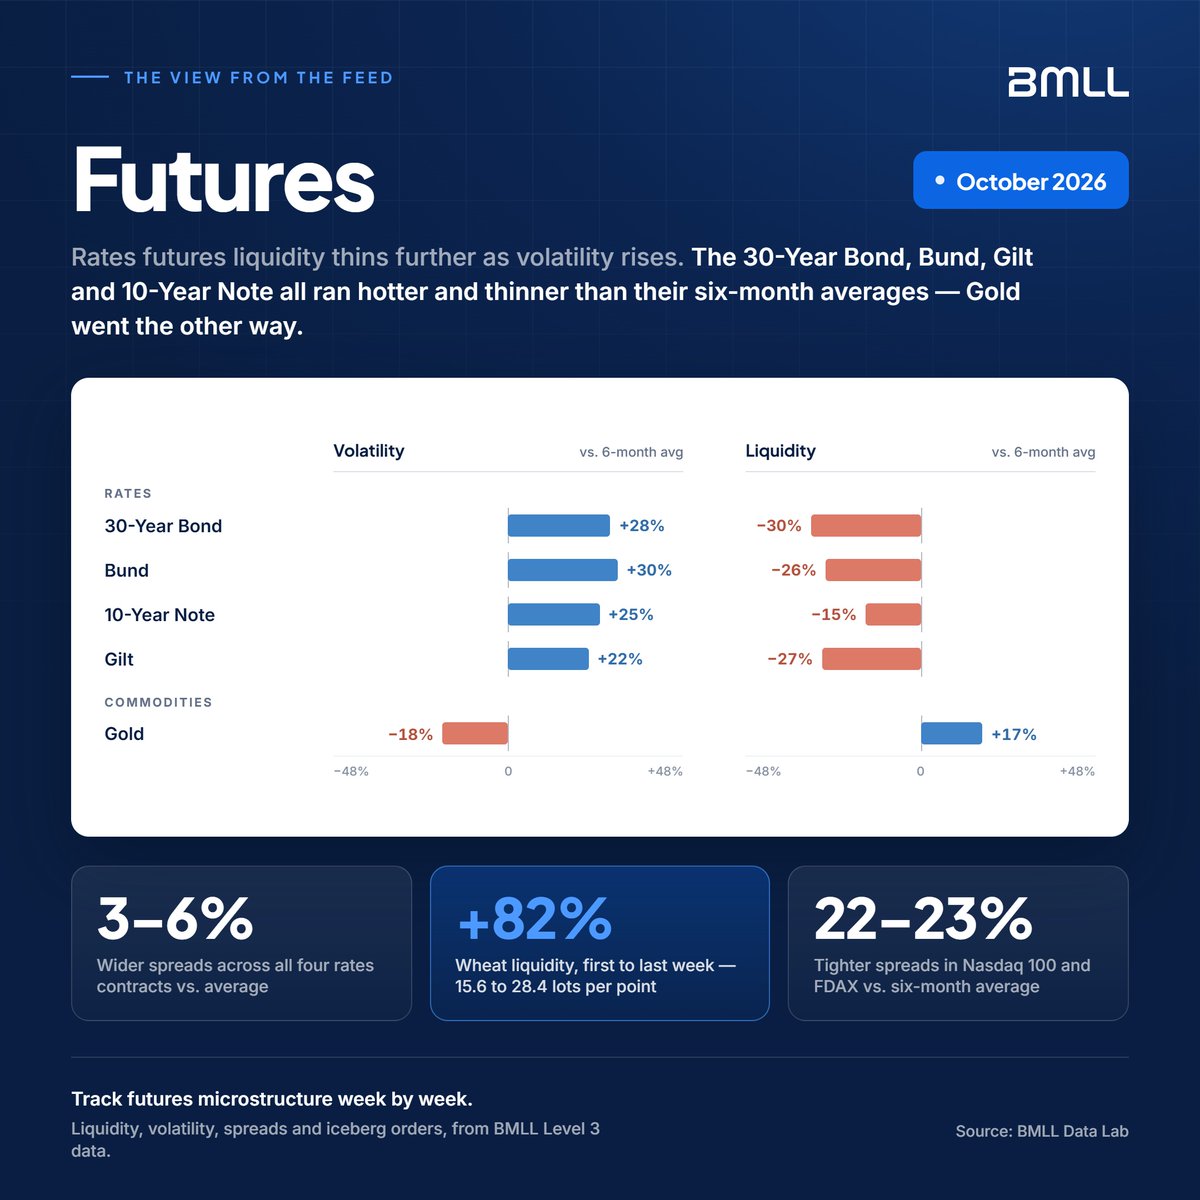
Spreads widened in every index we track in October, from 2% in HK82 to 15% in IT40.
Built from BMLL’s Level 3 Data and pre-calculated daily analytics, delivered via BMLL Data Feed.
See the full scorecard and charts: https://t.co/gTNRQ2IYv2
BMLL is a proud sponsor of QuantMinds London 2026, which is kicking off next week!
Find us at the Vola Dynamics & BMLL booth #21 where we will be showing the BMLL Data Lab - the data science platform that's designed by quants, trusted by the market.
BMLL is pleased to announce a partnership with Vola Dynamics, bringing market-maker-quality options analytics to unified historical data in a fully managed research environment.
Read the full press release: https://t.co/FdNEjvjasf
How much can you trust the data behind your strategy? Rob Laible, Head of Americas at BMLL, tackles data integrity and operational credibility at Talking Hedge Chicago on November 12. Come and join the conversation!
Different firms trade different flows. BMLL’s Rule 605 dashboard brings 135 detailed filings together, so you can compare reported execution quality by firm, security group and order size.
Find your firm. Explore the results: https://t.co/R30cmr4iAN
BMLL has expanded its European equities data coverage with the addition of four new stock exchanges:
- Bratislava (XBRA)
- Bucharest (XBSE)
- Ljubljana (XLJU)
- Zagreb (XZAG)
Explore our data coverage:
https://t.co/SabQzVrFkQ
BMLL is sponsoring the Future of Portfolio Management & AI Conference this Thursday.
If you’re attending, connect with our team to discuss how high-quality, harmonized market data can provide the foundation for better research, modelling and trading decisions.
Anyone measuring the overnight market from TAQ alone is missing its busiest hours.
Find out what TAQ leaves out of the overnight session, and how to measure all of it: https://t.co/7MaKUMNost
Thank you to everyone who joined the webinar on SEC amended Rule 605 disclosures, and to the panelists who led the conversation.
Did you miss the webinar? Watch the recording here: https://t.co/0uEphIzwFL
The BMLL team is heading to Chicago for FIA Expo from 2–4 November.
Meet us to see how BMLL provides harmonised Level 3 order book data and analytics across major global futures venues, ready for quantitative research and analysis.
BMLL will be at the FIX Americas Trading Conference in New York on October 29th.
Get in touch to connect with the team on the day: https://t.co/bjTzzPjIHt
The October edition of BMLL Market Lens: US Liquidity Maps is out now.
Explore 13 months of liquidity trends across the top 500 US stocks:
https://t.co/RYZvjpLSaR
At this year's STA Annual Market Structure Conference, Rob Laible, Alexa Koike, and Mike Hosford met with market participants to discuss how high quality historical data supports research.
Thank you to the STA for hosting this critical forum.
What do the amended SEC Rule 605 disclosures mean for market participants? Join the webinar on October 21st, at 3:00 PM BST / 10:00 AM EDT, to learn what these changes mean for you.
Don’t miss your chance to register: https://t.co/UyTebIsOUs
Thank you to everyone who visited the BMLL team at WFIC!
It was a pleasure to meet so many data buyers and to discuss how clean, harmonised, nanosecond-precision order book data that increases speed of strategy development and lowers total cost of ownership.
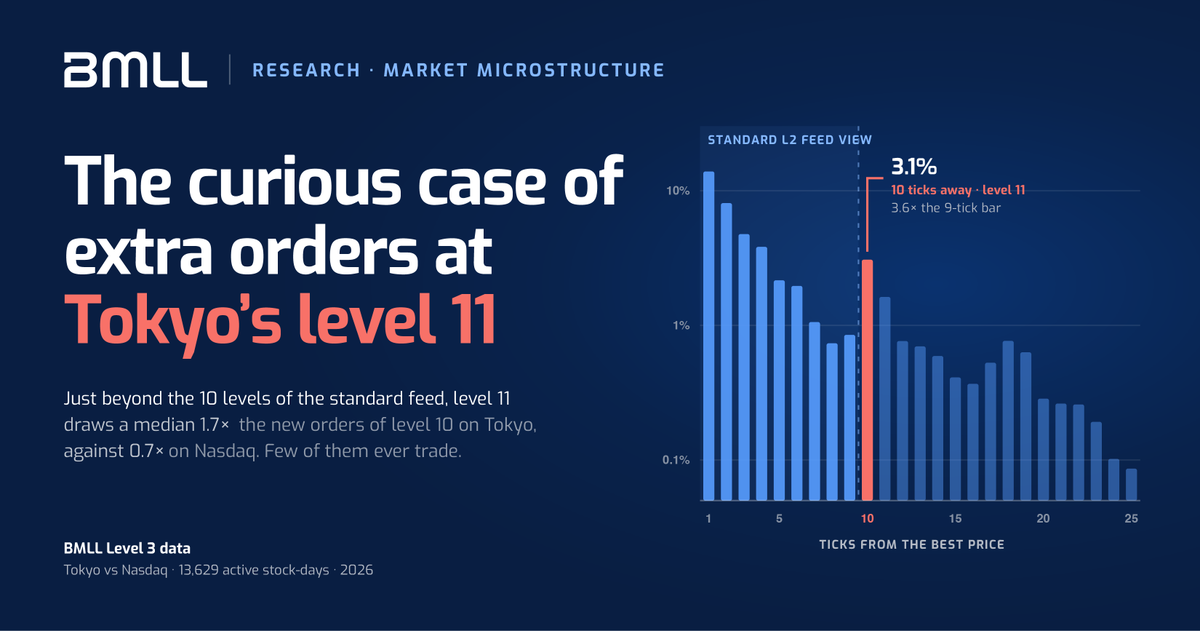
Why does level 11 on the Tokyo Stock Exchange draw more new orders than level 10?
BMLL Level 3 data records every order at every price, so you can analyse what a 10-level feed does not show.
Read the full analysis: https://t.co/gxHM2fnw1X
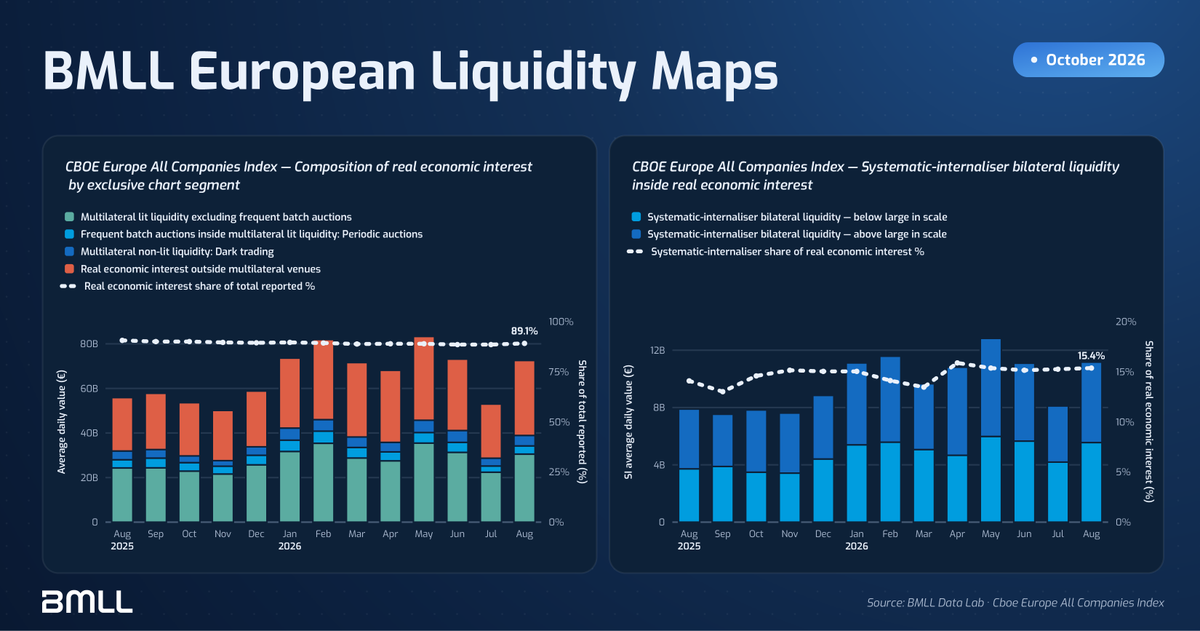
In this edition of European Liquidity Maps, we can see periodic auctions were flat over a year in which the European market grew 30%.
Read the full analysis: https://t.co/I2HnRfbdCa
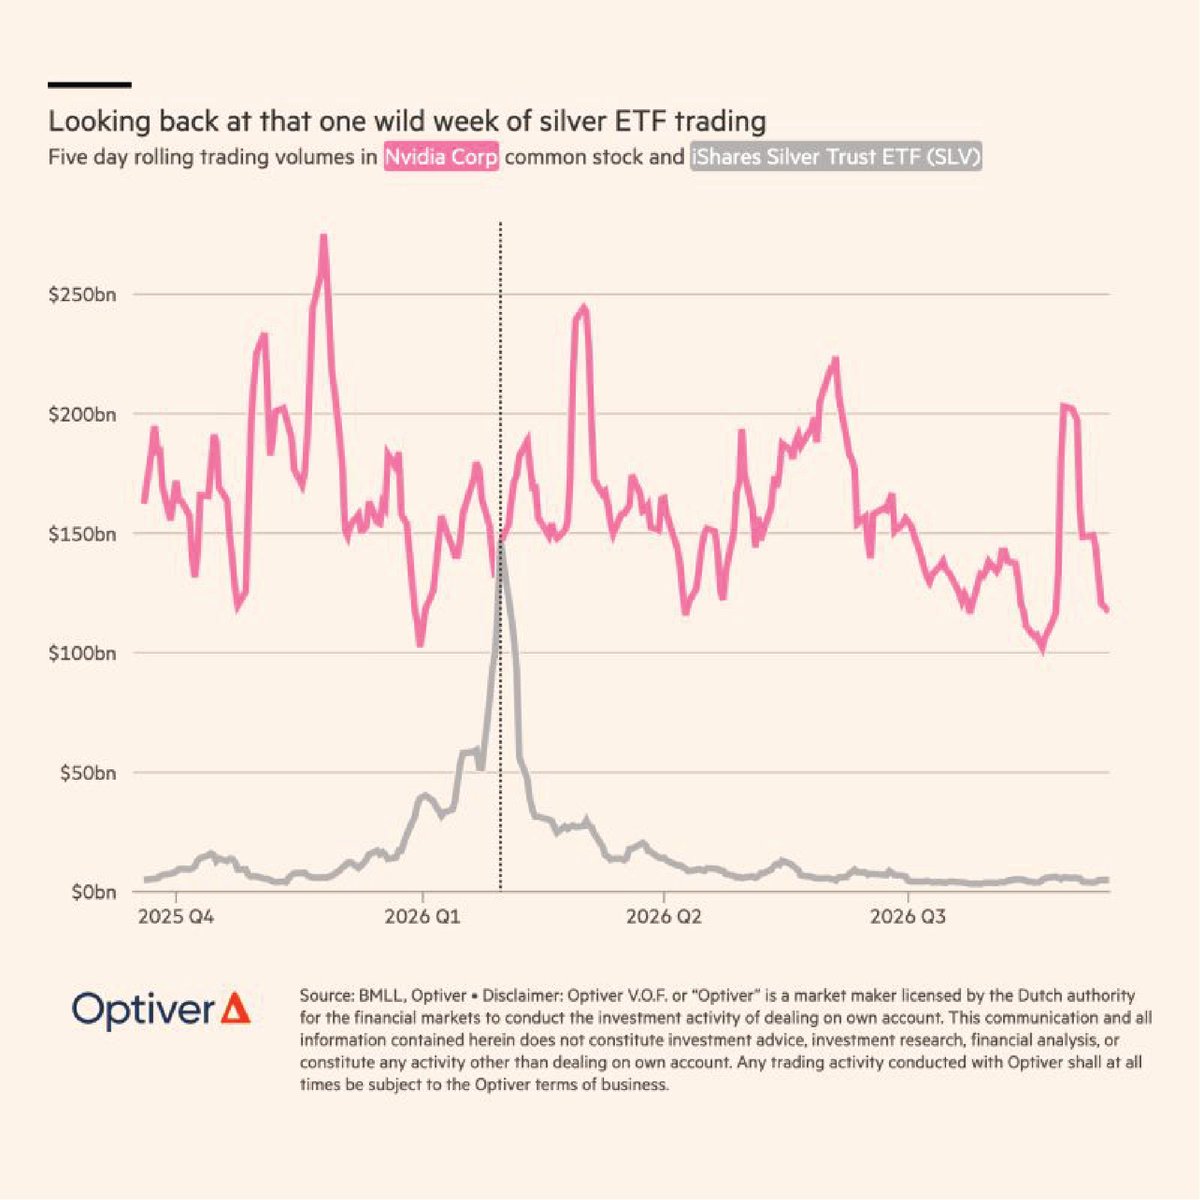
Over recent weeks, Optiver has published a series of charts drawing on BMLL data. Each shows what becomes possible when analysis starts from granular, trusted market data.