"Historic Mo-Unwind. GSPRHIMO -17% last two days. That ranks as the 8th worst 2-day performance in the index's history back to 1999. While the velocity might slow, we think directionally there is more unwind left to go."
You know where this is heading...
South Korea now has 102 million active trading accounts. The country has 52 million people.
While foreign investors net sold ₩120 trillion of Korean stocks this year, retail investors bought ₩75 trillion to absorb it. Largely with borrowed money.
The stress indicators are already there.
Household debt-to-income ratio sitting at 174%
44% of borrowers have missed or fallen behind on loan payments in the last 6 months.
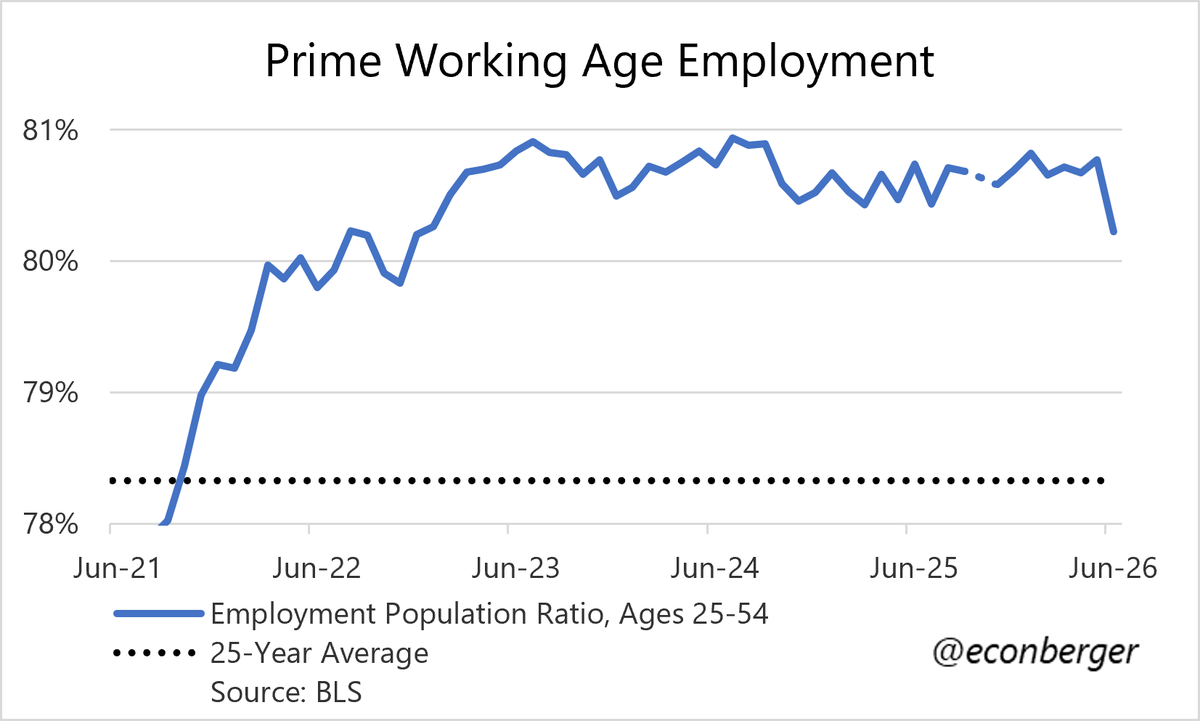
3/ There was a bizarre plunge in the prime working age employment/population ratio, to 80.2%. The lowest since 2022. The magnitude of the plunge feels like noise - happened almost entirely within the 25-34 age group.
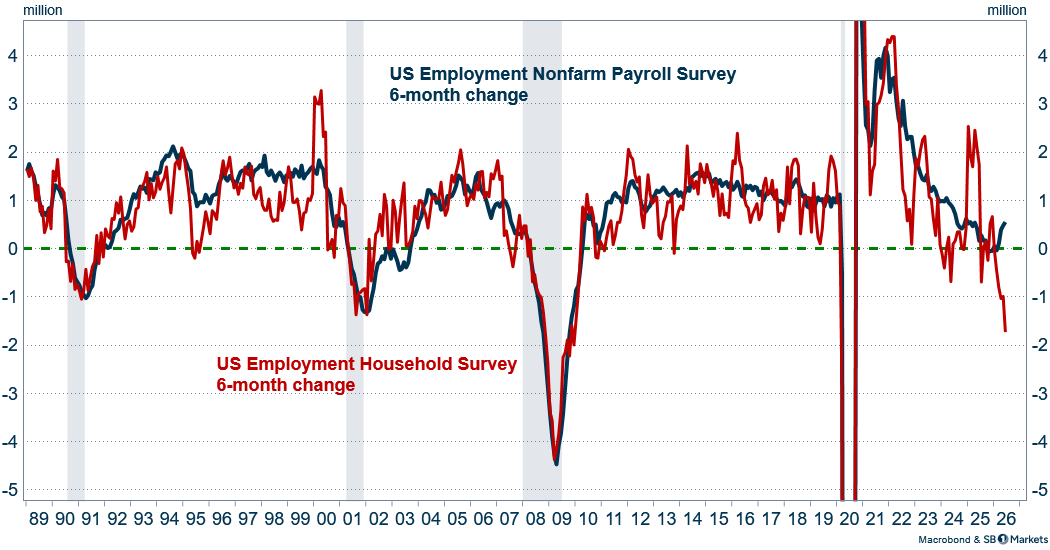
🇺🇸 Not sure what is going on here but employment according to the household survey is opening up a large gap vs NFP. If households believe that employment is falling it could affect consumption eventually. Likely not yet though acc. to Johnson Redbook strong weekly retail data
I'll have to look at response rates but this is really, really strange (especially given the age group concentration). World Cup dinging response rates?
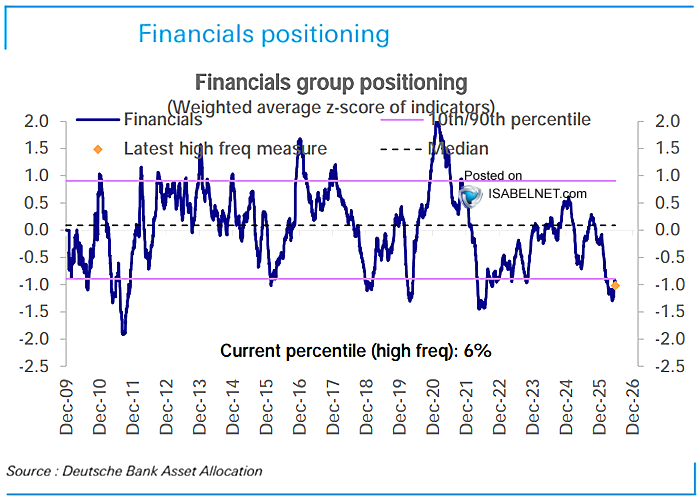
📌 Financials
Positioning in financials remains deeply underweight at the 6th percentile, leaving plenty of room to add risk. Given solid fundamentals, the caution feels increasingly unjustified
👉 https://t.co/blMxcoFA78
h/t @DeutscheBank#financials $spx #spx#stocks
🇪🇺 ECB's Wunsch tells Econostream the case for further tightening is receding, and any inflation surprise in the eurozone ahead of the July meeting is more likely to be to the downside.
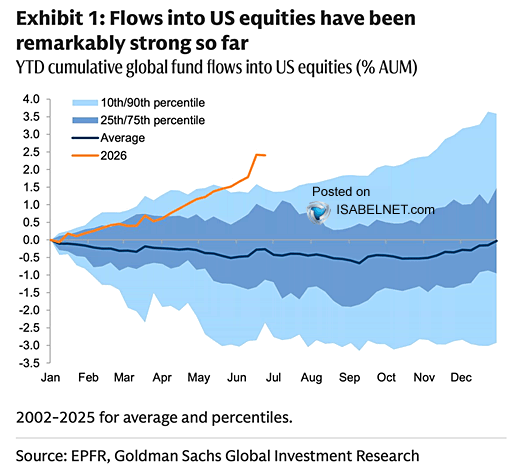
🇺🇸 Equities
US equity inflows have been running hot this year, with leveraged bets on US exceptionalism still firmly in place
👉 https://t.co/blMxcoFA78
h/t @dailychartbook $spx #spx
European natural gas storages are relatively low for this time of year, but still on track to reach 80 percent by 1 November.
Storages are 48 percent full on June 27. Extrapolating the recent 30 days trend meets the needed 0.25 %pts/day to reach 80 percent.
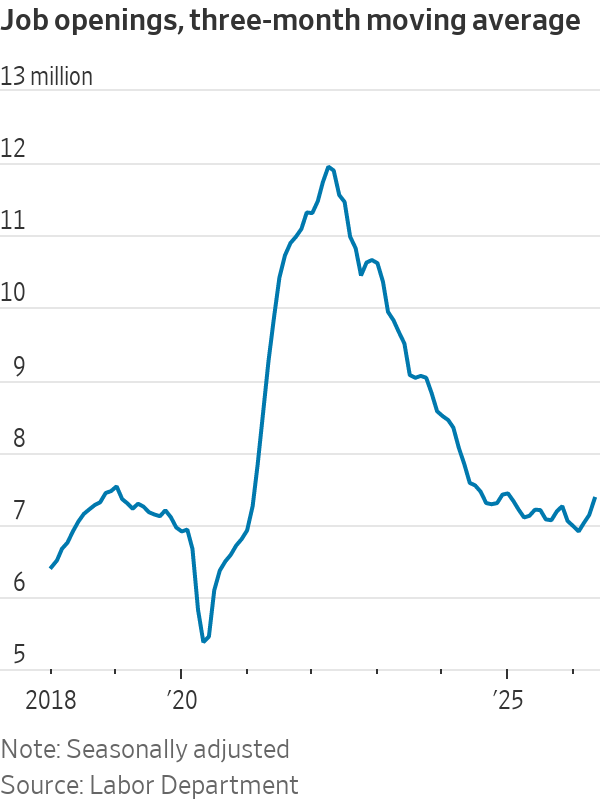
Two measures of job openings show the labor market stopped getting softer around the end of last year. From the May JOLTS series:
• There were 1.03 job vacancies for every unemployed worker, up from 0.87 in December
• At 7.36 million on a three-month average, job openings are at the highest level since Jan. 2025
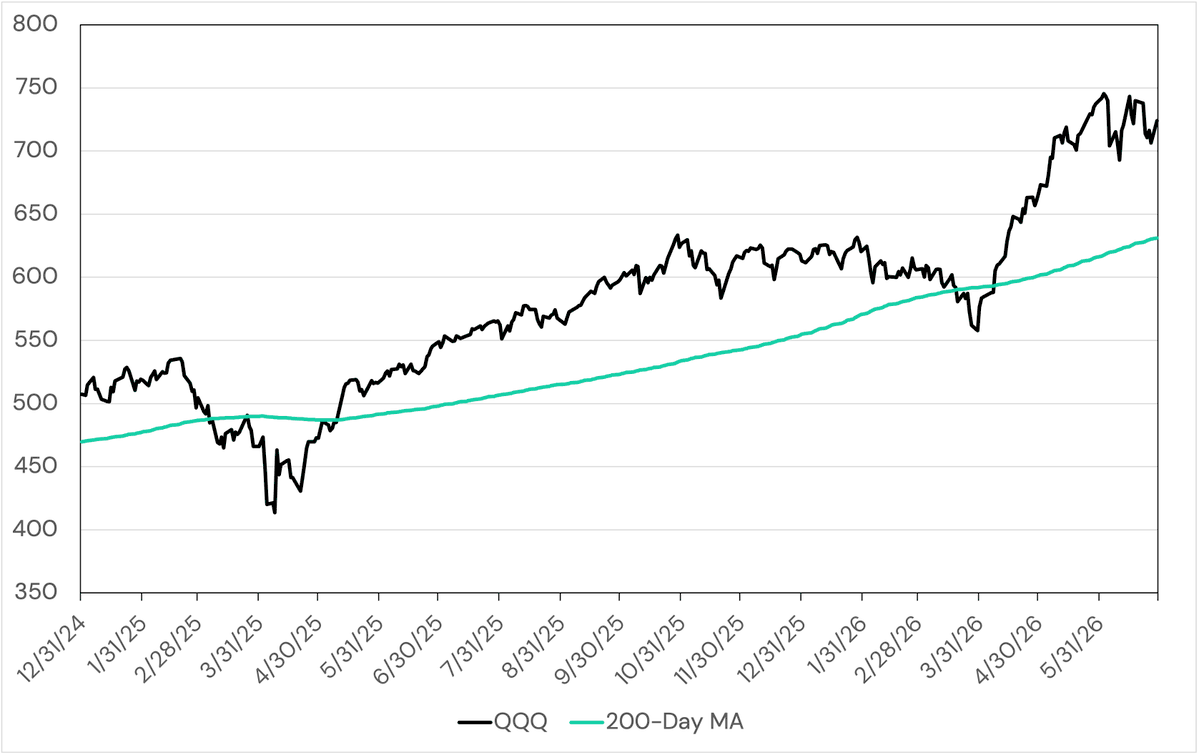
I know it's kind of stupid, but when something is 20% above its 200-day moving average, you'd need to see ~61% annualized return to maintain that distance.
g ≈ 2Y / (N-1)
(g is the daily growth rate; Y is the distance above moving average; N is the length of the moving average.)
CHART OF THE DAY: Brent Dated-to-Frontline spread, a key indicator of the strength (or weakness) of the physical crude market in the Atlantic. The DFL is at its weakest since mid-2023.
Saudi Arabia could slash August Arab Light OSPs for Asia by $6.5-$8/bbl to a 4-month low as Hormuz flows recover, Middle East supply rises, and spot Dubai/Oman differentials hit 6-year lows.
Foreign investment into the US is exploding:
US net capital inflows surged to a record +$884 billion in the 12 months ending April 2026.
This metric shows how much outside money is entering US financial markets through private investors and official institutions buying US assets.
Net capital inflows have nearly TRIPLED since the start of 2025.
By comparison, the 2021 peak was ~$400 billion, less than half of current levels.
Total private purchases of US equities jumped to $763 billion in April, an all-time high.
Official institutions' purchases rose to a record $121 billion, more than doubling since the start of the year.
Global appetite for US assets is unprecedented.
Core goods prices fell 0.10% in May, only the third month in which prices have declined in the last year. This lowered the 12-month change to 2.4% from 2.8% in April.