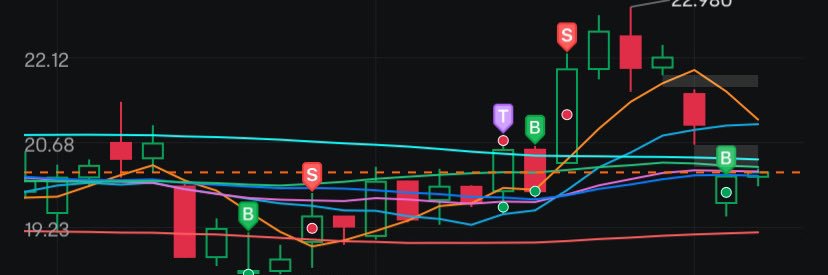
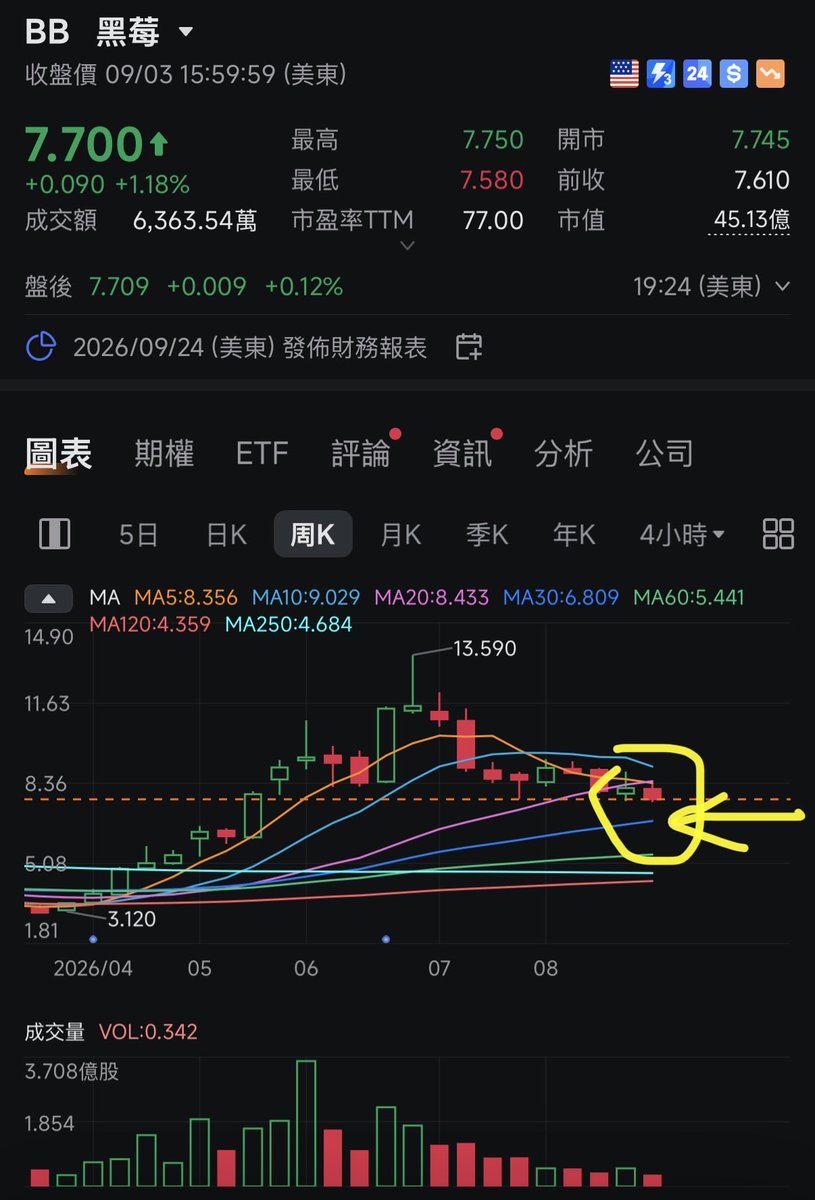
Most people think and react like this:
1. Stock goes up
2. ‘Oh it really goes up!’ Then buy.
3. Actually the stock has hit resistance; that’s why it has halted and retraced a bit.
4. ‘Oh it’s going down!’ Then sell.
5. Repeat 1. That’s how people buy high and sell low…
$CIFR: On the daily chart a huge wedge seems to be forming, obviously with some wick downs (bear traps) and wick ups (bull traps) along the way. This pattern often resolves to the upside and this is my how I see it going forward. Break the upper channel and it will skyrocket.
$TSLA: Cooling a bit after the gap up run and the dome shape is playing out with pre market price plummeting to where the yellow line lies. Healthy pullback is how I see this.
I trimmed $HOOD when it was around $100 and got into $ETH and funnily it turned out to be an unnecessary move...at least not a 'wrong' one. I still have multiple positions from the 70s and 80s, so I'm OK!
$CIFR: Yes it broke line 1, but line 2 is still intact and we can see a wedge pattern forming from the price compression between lines 2 and 3. Not 100% guaranteed, but this pattern usually resolves to the upside. Compare with the previous purple one and you can see it.