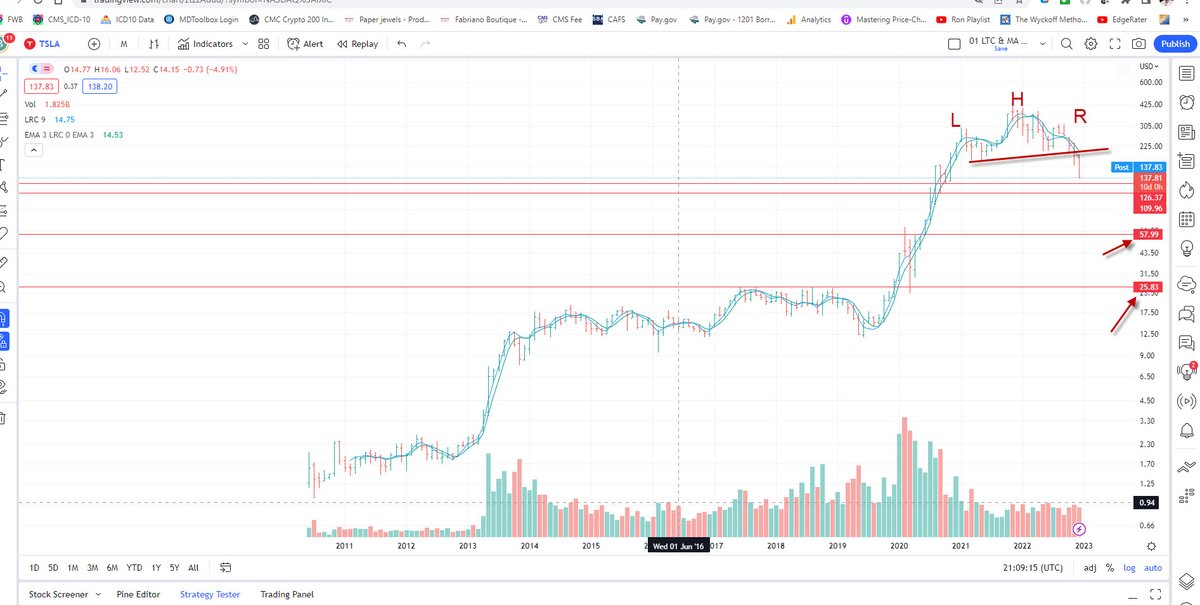
@wclemente With the September open, BTC and ETH have seen their LRC 9 (linear regression curve) cross down through the 3 ema on a monthly chart. This is a multi month phenomenon and suggests lower prices ahead. The last crossover was up in January.
@WalterDeemer@DougKass Walter using WSJ data I am getting a second Deemer Thrust today with the ratio at 2.04. What is the significance of 2 signals over 3 trading days?