Having a legal framework that allows for a statistical system to be fit for the digital age and deliver on its mission is crucial. The recent European Commission proposal for amending the Regulation 223/2009 on European statistics could be found at https://t.co/nh1Z0oZQ0l
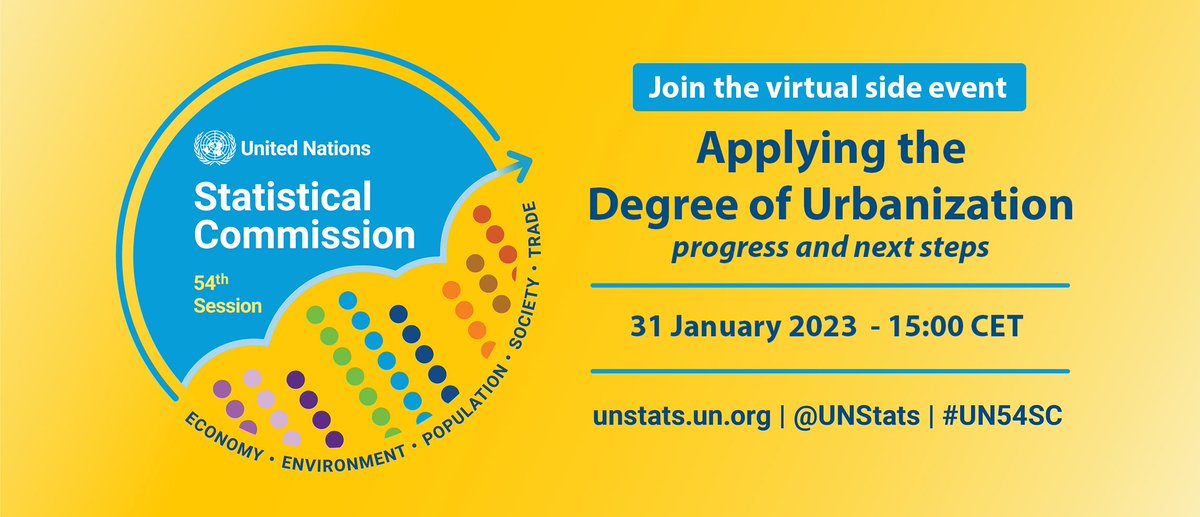
💻🏙️Join our webinar on ‘Applying the Degree of Urbanization’, a virtual side event of the #UN54SC
🗓️ 31 January 2023 at 15:00 CET
Register here 👉https://t.co/YAyfFmWiwq
ℹ️ Discover the methodology for delineation of cities, urban & rural areas
#DEGURBA
Join us for the #UN54SC side event on Applying the Degree of Urbanization - progress & next steps on Jan 31st, 9am EST!
Learn about national experiences since the @UN StatComm endorsed this new methodology in 2020.
Register here: https://t.co/OhQoy3rX69
#Urbanization#DEGURBA
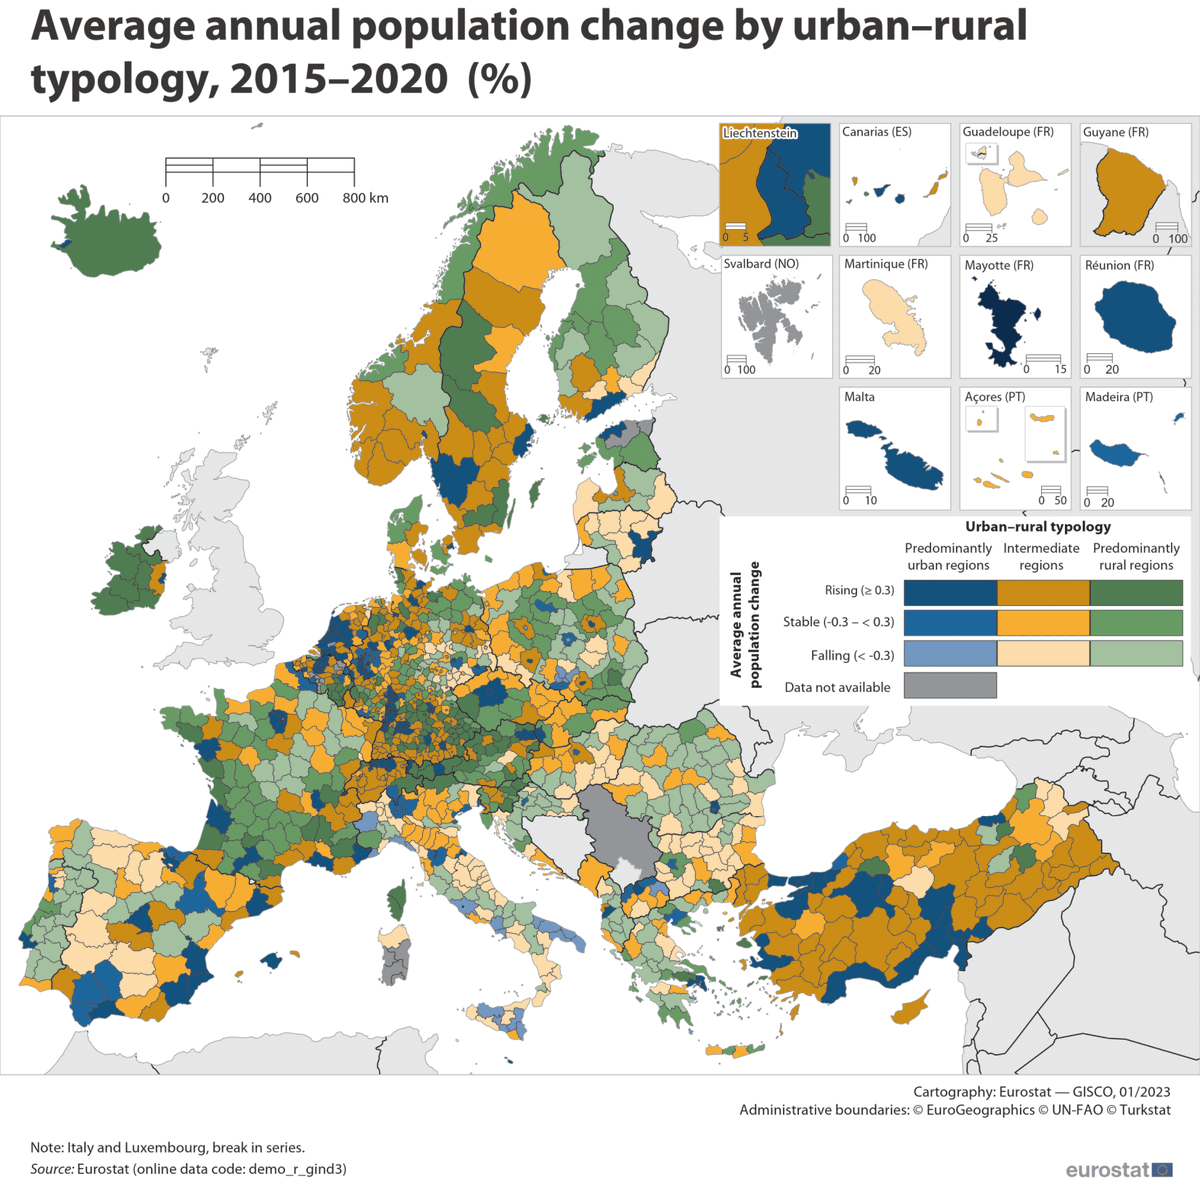
🧑🤝🧑In the EU, over the period 2015-2020, the number of people aged 20-64 years old living in rural regions fell by 0.6% each year. People less than 20 years old fell by 0.7% each year. These 2 groups experienced growth in urban regions (0.1% and 0.3%).
👉https://t.co/Q4YgBSsA3Q
🧑🤝🧑Over the period 2015–2020, the rural region with the highest rates of depopulation in the EU was:
🇭🇷 Vukovarsko-srijemska županija (-2.5% per year)
The rural region with the highest population growth:
🇬🇷 Ikaria, Samos (+2.8% per year)
👉https://t.co/Q4YgBSsA3Q
Building on the lessons of the Covid-19 crisis, we need to continually invest and innovate, as well as building up mechanisms for coordinated statistical responses to future crises #IAOS2022
IMAGE V4 release last night - thanks @EU_Eurostat#GISCO team especially @JoeWDavies@julgaf for plenty of new features - test it out and let us know https://t.co/elNBB5KBGC (1/x)
🔎Check your facts with our new tool “COUNTRY FACTS”❗
🇪🇺 Choose up to 5 EU or EFTA countries & compare them across a variety of indicators on society, economy & environment❗
You can download your customised factsheet as a PDF with our factsheet creator👉https://t.co/rPVpxa825S
📢Eurostat is participating with a virtual stand at the 9th European Summit of Regions and Cities, 3 & 4 March 2022, presenting interesting regional data.📊📈
Register to join online here❗👉https://t.co/ZPJjsX6dde
🏙️🏡Take a look at the Eurostat publication 'Applying the Degree of Urbanisation' and learn how to to define cities, towns and rural areas for international comparisons❗➡️https://t.co/OHCXhJpZ7I
🗺️🔍 Have you ever wondered how our statistical #maps are made ❓
Would you like to create your own? 👀
🖥️🎨 IMAGE is a web-based-tool allowing users to quickly make professional #statistical maps. It contains a number of predefined templates 🖌️
👉🏿 https://t.co/RMvB0exneG
How about demographic diversity in EU #cities ❓🏙️ #WorldCitiesDay
In 2018, there were on average 3 people of working age for every older person (old-age dependency ratio).
Which cities recorded the lowest ratios and which the highest ones ❓
➡️ https://t.co/Pie1tfW9Ka
This week is #EURegionsWeek and to that occasion @EU_eurostat published its Regional Yearbook in an online format for the 1st time, full with interactive visualisations https://t.co/nZapFezhYF I consulted with the team behind it on the design and ux of the viz and publication 4/5
The median age has increased in all regions of the EU, from an average of 38.4 years in 2001 to 43.7 years in 2019.
Do you know which EU region had the highest median age in 2019 ❓ 👵🧑🦱
Are you a fan of Eurostat regional yearbook ❓🤩
You are in for a treat ❗️🍬
🆕🆕🆕 Its digital version is available NOW 🆕🆕🆕
➡️ You can start scrolling here: https://t.co/cGx657Jhj9
#EUregions#EURegionsWeek
Are you a fan of Eurostat regional yearbook 2020 ❓🤩
You are in for a treat ❗️🍬
🆕🆕🆕 digital version is coming soon 🆕🆕🆕
When ❓ 12 October 2020 👀 Stay tuned ❗️
#EUregions#EURegionsWeek